Pyramid Diagram and Pyramid Chart
Pyramid diagram, triangle chart, triangular diagram
The pyramid diagrams, triangle charts and triangular diagrams help to visualize hierarchical, proportional and foundation-based relationships, process steps, organizational layers or topics interconnections.
The Pyramid diagrams solution from Marketing area of ConceptDraw Solution Park provides examples, templates and vector stencils library.
You can use it to illustrate your documents, infographics, presentations and websites with pyramid diagram, triangle chart and triangular diagram using ConceptDraw DIAGRAM diagramming and vector drawing software.
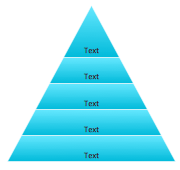
Basic Pyramid Diagram
You can edit this basic 5 levels pyramid diagram template in ConceptDraw DIAGRAM to create your own multilevel triangle chart.
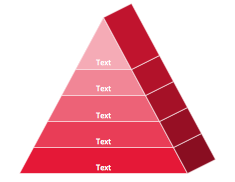
Pyramid Diagram Isometric
Simply type in your labels and title into this isometric 3D triangle chart template using the ConceptDraw DIAGRAM application.
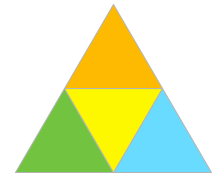
Triangle Chart
Fill this segmented pyramid diagram template with your text in the ConceptDraw DIAGRAM software.
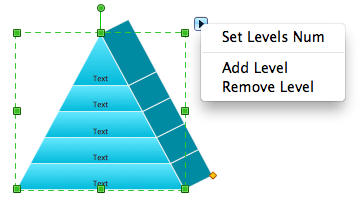
How to Draw a Pyramid Diagram
Some of the ConceptDraw pyramid diagram templates are interactive and allow to change number of levels.
Example for the Pyramid Diagram
This market value pyramid diagram has 5 levels:
- Essence (Who we are),
- Competitive positioning (Where we play),
- Customer benefits (Value proposition),
- Product / Service features (Value delivery),
- Internal capabilitiea (Value requirements).
Free Download Pyramid Chart Software and View All Examples
Use this triangular scheme to develop your marketing strategy.

Example 1. Pyramid diagram example - Market value pyramid
More Related Diagrams:
TEN RELATED HOW TO's:
The purchase or purchasing funnel is a consumer focused marketing model which illustrates the theoretical customer journey towards the purchase of a product or service.
Picture: Pyramid Diagram
Related Solution:
You need design pictorial food images to decorate menu of your restaurant or to create beautiful advertising materials? We recommend to use a ConceptDraw DIAGRAM diagramming and vector drawing software extended with Food Court solution from the Food and Beverage area of ConceptDraw Solution Park for easy designing colorful food images.
Picture: Food Images
Related Solution:
This sample shows the Business Report Pie Chart. The Pie Chart visualizes the data as the proportional parts of a whole, illustrates the numerical proportion. Pie Charts are very useful in the business, statistics, analytics, mass media.
Picture: Business Report Pie. Pie Chart Examples
Related Solution:
ConceptDraw DIAGRAM is a powerful diagramming and vector drawing software which offers the extensive drawing tools for creating various types of diagrams. Extended with Pyramid Diagrams Solution from the Marketing Area, it became the best Pyramid Chart Maker.
Picture: Pyramid Chart Maker
Related Solution:
Create bar charts for visualizing problem solving in manufacturing and economics using the ConceptDraw DIAGRAM diagramming and vector drawing software extended with the Bar Graphs Solution from the Graphs and Charts area of ConceptDraw Solition Park.
Picture: Bar Diagrams for Problem Solving. Create manufacturing and economics bar charts with Bar Graphs Solution
Related Solution:
A triangular graphic representing Graham's "hierarchy of disagreement", based on Paul Graham's March 2008 essay "How to Disagree".
Picture: Pyramid Diagram
Related Solutions:
Processing Flow Chart is a simplified sketch which is used in chemical and process engineering for illustrating general plant streams, major equipments and key control loops.
ConceptDraw DIAGRAM enhanced with Flowcharts Solution from the "Diagrams" Area of ConceptDraw Solution Park is a powerful Processing Flow Chart software which will help save lots of your time.

Picture: Processing Flow Chart
Related Solution:
You can use many tools to create a representation of a system behavior or a scheme of objects relationships. Some of them are quite abstract and useless, and some, like UML tools help clarifying both the structure and the behavior of a system. There are various types of uml diagrams and tons of examples explaining the difference between them.
UML 2.2 specification has many kinds of diagrams. They are divided into two groups( structure and behavior diagrams). This class diagram shows the hierarchical structure of UML 2.2 specification. Class diagram - the most suitable tool for this task because it is designed to describe basic structure of a system. This diagram can be use as a visual aid for learning UML.
Picture: UML Tool & UML Diagram Examples
Related Solution: