Problem solving
Management and Planning
ConceptDraw OFFICE suite is a software for the problem solving. The Seven Management and Planning Tools solution is a set of such tools for investigating complex problems.
These tools are exemplary at
- organizing research,
- parsing complex problems,
- providing a structure for the details,
- helping managers make decisions,
- and organizing effective communications in a visual manner that keeps everyone involved.

Pic.1 Problem Solving — Root Cause Analysis Tree Diagram
With a root cause identified, you can work on causation, and solutions to implement that will address this problem. Problems and solutions are displayed side by side to help when analyzing.
See also:
TEN RELATED HOW TO's:
This sample shows the Influence Diagram. It was created in ConceptDraw DIAGRAM diagramming and vector drawing software using the Basic Diagramming Solution from the Universal Diagramming area of ConceptDraw Solution Park.
Influence diagram represents the directed acyclic graph with three types of nodes and three types of arcs that connect the nodes. Decision node is drawn as a rectangle, Uncertainty node is drawn as an oval, Value node is drawn as an octagon.
Picture: Influence Diagram
Related Solution:
You need to draw Authority Matrix Diagram quick and easy? Design it with ConceptDraw DIAGRAM!
ConceptDraw DIAGRAM extended with Seven Management and Planning Tools solution from the Management Area is the best Authority Matrix Diagram Software.
Picture: Authority Matrix Diagram Software
Related Solution:
In the case of origin of an emergency is very important to have a correct, clear and comprehensible action plan which will help you to react quicker and to make right decisions. ConceptDraw DIAGRAM software extended with Fire and Emergency Plans solution from the Building Plans Area of ConceptDraw Solution Park provides extensive drawing tools for quick and easy creating fire and emergency plans, and also a set of various templates and samples, among them the Emergency Action Plan Template.
Picture: Emergency Action Plan Template
Related Solution:
Risk Analysis. ConceptDraw OFFICE suite is a software for decision making. The Seven Management and Planning Tools is a tool for Risks Diagram drawing. This diagram identifies possible risks in accomplishing corrective actions. With the Risks Diagram, one analyzes each action separately in a tree of all actions and develops a preventive action in response of each potential obstacles or circumstances which may be a risk.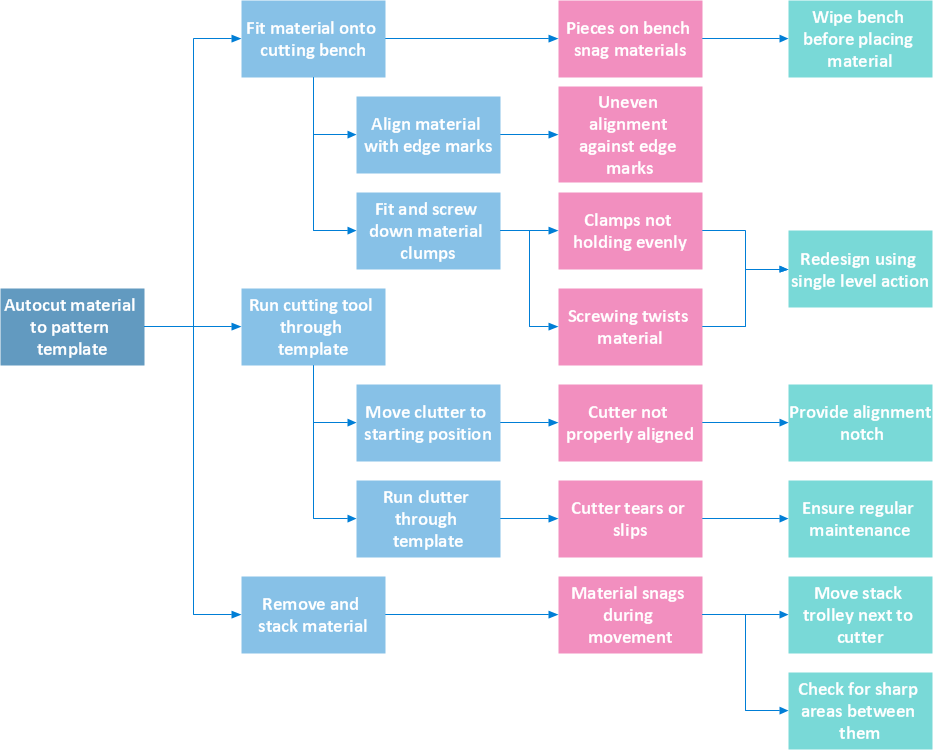 The Venn diagram example below shows sustainable development at the confluence of three constituent parts.
Create your Venn diagrams for problem solving in environmental social science using the ConceptDraw DIAGRAM software.
The Venn diagram example below shows sustainable development at the confluence of three constituent parts.
Create your Venn diagrams for problem solving in environmental social science using the ConceptDraw DIAGRAM software.
Picture: Risk Analysis
Create bar charts for business management problem solving and data comparison using the ConceptDraw DIAGRAM diagramming and vector drawing software extended with the Bar Graphs Solution from the Graphs and Charts area of ConceptDraw Solition Park.
Picture: Bar Diagrams for Problem Solving.Create business management bar charts with Bar Graphs Solution
Related Solution:
The Wireless Network solution helps users to quickly transition from an idea to the implementation of a wireless computer network.
ConceptDraw DIAGRAM is well placed to provide experienced and comprehensive assistance in the workplace.
The vector stencils, examples, and templates included to solution is a strong toolset for network engineer.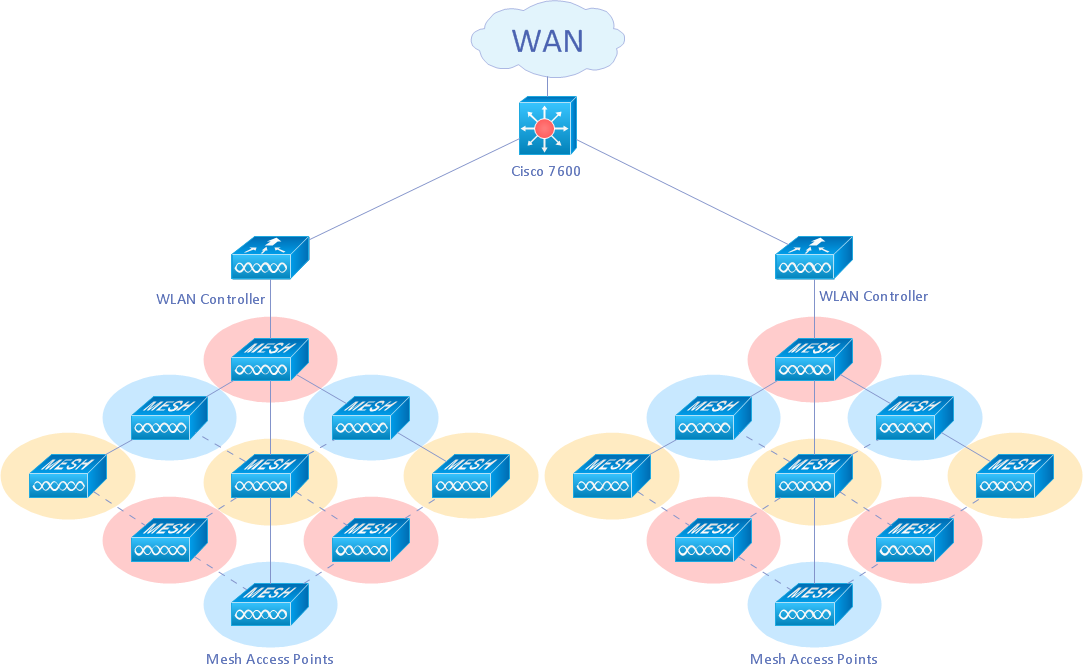
Picture: Wireless Network Drawing
Related Solution:
Activity Network and Project Evaluation and Review Technique, or PERT, charts are a way of documenting and analyzing the tasks in a project.
This diagram is constructed as part of the process in creating a schedule of corrective actions. The Activity Network Chart (PERT) shows the logical connections and consequence of tasks to be performed. It displays the time period for problem solving and the implementation of all activities through the critical path.
Picture: Activity Network (PERT) Chart
Related Solution:
A flowchart is a simple but very functional tool when it comes to understanding a workflow or to removing unnecessary stages from a process. When drawing flowcharts, keep in mind that there are four common types of flowcharts, like document flowcharts and data flowcharts that show control over a data or document flow over a system. To show controls on a physical level, use system flowcharts. In addition, to show controls in a program, you can draw a program flowchart.
This flowchart diagram represents the piece of an article editing process, that involves the author and editor. It was created using the Basic Flowchart notation that consists from the basic flowchart symbols. The start and the end of the process are indicated with "Terminator" symbols. The "Process" symbols show the action steps consisting from making edits and searching for a compromise, when the author does not agree with the suggestions of the editor. The "Process" symbol is the general symbol in process flowcharts. The "Decision" symbol indicates a branching in the process flow. There are two branches indicated by a Decision shape in the current flowchart (Yes/No, Disagree/Agree). This basic flowchart can be used as a repeating unit in the workflow diagram describing the working process of some editorial office.
Picture: Types of Flowcharts
Related Solution:
The Total Quality Management Diagram solution helps you and your organization visualize business and industrial processes. Create Total Quality Management diagrams for business process with ConceptDraw software.
Picture: TQM Diagram — Professional Total Quality Management
Related Solution:
Venn Diagram Examples for Problem Solving
Environmental Social Science
Human Sustainability Confluence
→Picture:
Venn Diagram Examples for Problem Solving
Environmental Social Science
Human Sustainability Confluence
Related Solution:
ConceptDraw
DIAGRAM 18