Preventive Action
Management and Planning
ConceptDraw OFFICE suite is a software for the Preventive Action making. The Seven Management and Planning Tools solution is a set of such tools for problems preventive actions via investigating of the core problem.
Skilled use of these diagrams makes collaborative teamwork both more engaging and more effective.

Pic.1 Preventive Action. Process decision program chart (PDPC) — Minimization of Material Wastage
Risk diagram (process decision program chart, PDPC) helps you to identify risk factors and define preventive actions.
See also:
TEN RELATED HOW TO's:
This mind map shows 8 steps approach to solving any kind of product or service problems.
Picture: 8 Step Problem Solving
Related Solution:
Every engineering project starts from a terms of reference document. The next stage of developing is a technical drawing, which requires using appropriate software. However, revisions and discussions about requirements are possible at any stage of development.
This technical drawing demonstrates a schematic flow diagram of pulp reclaiming. This diagram of magnetite pulp reclaiming is created using ConceptDraw Chemical and Process engineering solution, The solution delivers more than 460 vector graphic icons and connectors. Generally, it is intended for designing process and instrumentation diagrams (P&ID) for chemical and process engineering. block flow diagrams (BFD), process flow diagrams (PFD) for chemical industry.
Picture: Technical Drawing Software
Related Solution:
Mindmap Presentation. Present Mindmaps via Skype with ConceptDraw MINDMAP.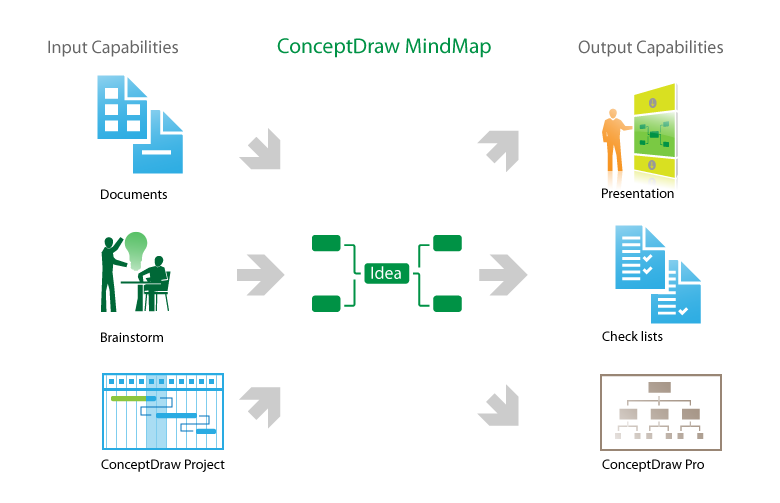
Picture: MindMap Presentation
Related Solution:
Electrical Engineering Solution used together with ConceptDraw DIAGRAM drawing facilities makes short a work of drawing various electrical and electronic circuit schemes. A library of vector objects composed from symbols of Analog and Digital Logic elements of electric circuit includes 40 symbolic images of logic gates, bistable switches of bi-stable electric current, circuit controllers, amplifiers, regulators, generators, etc. All of them can be applied in electronic circuit schemes for showing both analog and digital elements of the circuit.
Electrical Engineering Solution used together with ConceptDraw DIAGRAM drawing facilities makes short a work of drawing various electrical and electronic circuit schemes. A library of vector objects composed from symbols of Analog and Digital Logic elements of electric circuit includes 40 symbolic images of logic gates, bistable switches of bi-stable electric current, circuit controllers, amplifiers, regulators, generators, etc. All of them can be applied in electronic circuit schemes for showing both analog and digital elements of the circuit.
Picture: Electrical Symbols, Electrical Diagram Symbols
Related Solution:
If you want to find a way to understand complex things in minutes, you should try to visualize data. One of the most useful tool for this is creating a flowchart, which is a diagram representing stages of some process in sequential order. There are so many possible uses of flowcharts and you can find tons of flow charts examples and predesigned templates on the Internet. Warehouse flowchart is often used for describing workflow and business process mapping. Using your imagination, you can simplify your job or daily routine with flowcharts.
Warehouse flowcharts are used to document product and information flow between sources of supply and consumers. The flowchart provides the staged guidance on how to manage each aspect of warehousing and describes such aspects as receiving of supplies; control of quality; shipment and storage and corresponding document flow. Warehouse flowchart, being actual is a good source of information. It indicates the stepwise way to complete the warehouse and inventory management process flow. Also it can be very useful for an inventory and audit procedures.
Picture: Flow chart Example. Warehouse Flowchart
Related Solution:
Planning a water supply system is one of the stages of developing a building drawing. Although materials are constantly improved, design elements for plumbing haven't changed sufficiently for decades. This is due to necessity of maintaining very old systems.
The plan and schematic drawing of plumbing equipment, water pipe junctions and, kitchen facilities a is a rather significant element of a building plan. The suite of 4 vector libraries supplied with ConceptDraw solution for Plumbing and Piping Planning includes near 130 vector images of pipes, boilers, water pipe junctions, tanks and other plumbing devices, helpful when creating plumbing and piping plans, and blueprints of sewerage or water supply systems.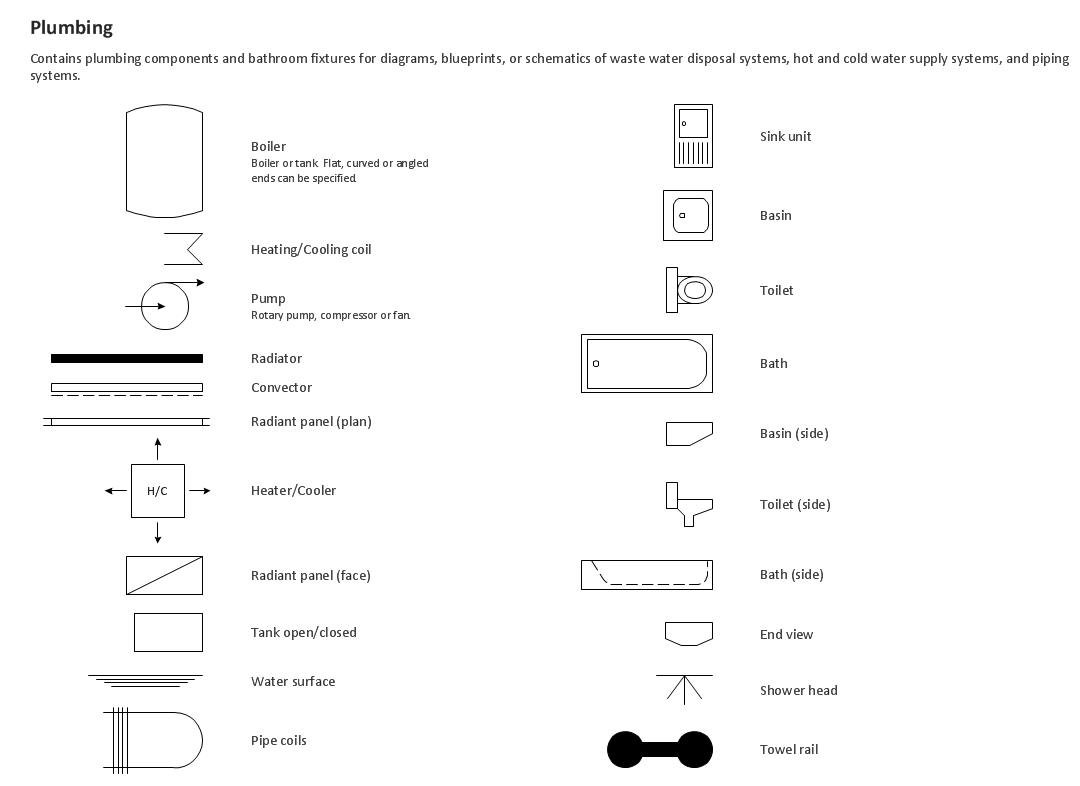
Picture: Building Drawing. Design Element — Plumbing
Related Solution:
ConceptDraw DIAGRAM software extended with Fishbone Diagrams solution from the Management area of ConceptDraw Solution Park is perfect for Cause and Effect Diagram creating. It gives the ability to draw fishbone diagram that identifies many possible causes for an effect or a problem. Causes and Effects are usually grouped into major categories to identify these sources of variation. Causes and Effects in the diagram show relationships among various factor. Fishbone diagram shows factors of Equipment, Process, People, Materials, Environment and Management, all affecting the overall problem.
Picture: Cause and Effect Diagram
Related Solution:
This sample shows the Flowchart that displays the layout and work flow of the cloud marketing platform. This diagram has a style of the marketing brochure. This style displays the central product that is related to the other issues.
Using the ready-to-use predesigned objects, samples and templates from the Flowcharts Solution for ConceptDraw DIAGRAM you can create your own professional looking Flowchart Diagrams quick and easy.
Picture: Flowchart Marketing Process. Flowchart Examples
Related Solution:
ConceptDraw
DIAGRAM 17