HR Flowchart Symbols
Human resources is the term given to the people who make up the employee workforce of an organization or company. It was initially used simply as a synonym for manpower or labour; latterly, with the advent of globalization, a cottage industry has grown regarding human resource strategy, as a way of enhancing business value through management of the workforce.
Human resource management has four basic functions:
- Staffing,
- Training and development,
- Motivation,
- Maintenance.
The ability to create flowcharts representing various HR processes and workflows is made possible with ConceptDraw’s HR Flowcharts solution. A comprehensive selection of predesigned vector stencils libraries allow you to create eye-catching infographics relating to any human resource management process. Also included are standardized flowchart notation symbols, meaning your diagrams will be relevant and understood by all business associates. We try to make things easy for you at ConceptDraw, so you will also find flowchart and workflow templates inside the solution to help you get started with your own design. Using the HR Flowcharts solution, you can create professional looking HRM business process diagrams in a matter of moments.
This solution includes incredibly large collection of hr flowchart symbols libraries:
- HR Arrows library contains 57 arrows shapes
- HR Department library contains 49 department symbols
- HR Flowchart library contains 62 flow chart symbols
- HR Professions library contains 81 professions pictograms
- HR Steps library contains 32 workflow step symbols
- HR Symbols library contains 45 HR process pictograms
- HR Workflow library contains 60 workflow symbols

Example 1. HR Flowchart Symbols
Follow the next steps for design any HR Flowchart:

Example 2.
- add the required symbols from the HR Flowcharts libraries (example 3.),

Example 3.
- arrange the shapes and connect them with arrows (example 4.),

Example 4.
- type the text (example 5.),

Example 5.
- add pictograms (example 6.),

Example 6.
- result - human resources flowchart (example 7.).

Example 7.
The HR Flowcharts solution is an incredibly powerful tool for those who need to analyze or present human resource process flows in a visually effective manner.
TEN RELATED HOW TO's:
Electrical Engineering Solution used together with ConceptDraw DIAGRAM drawing facilities makes short a work of drawing various electrical and electronic circuit schemes. A library of vector objects composed from symbols of Analog and Digital Logic elements of electric circuit includes 40 symbolic images of logic gates, bistable switches of bi-stable electric current, circuit controllers, amplifiers, regulators, generators, etc. All of them can be applied in electronic circuit schemes for showing both analog and digital elements of the circuit.
Electrical Engineering Solution used together with ConceptDraw DIAGRAM drawing facilities makes short a work of drawing various electrical and electronic circuit schemes. A library of vector objects composed from symbols of Analog and Digital Logic elements of electric circuit includes 40 symbolic images of logic gates, bistable switches of bi-stable electric current, circuit controllers, amplifiers, regulators, generators, etc. All of them can be applied in electronic circuit schemes for showing both analog and digital elements of the circuit.
Picture:
Electrical Diagram Symbols F.A.Q.
How to Use Electrical ConceptDraw Diagram Software
Related Solution:
A flowchart is a picture of the separate steps of a process in sequential order.
ConceptDraw DIAGRAM is a Process Flowcharts software. This software includes basic package of process flow examples. The software contains object libraries with vector stencils that allows you use RapidDraw technology. By clicking on direction arrows you can add a new object to the flowchart.
Picture: Example Process Flow
Related Solution:
ConceptDraw DIAGRAM is a business flowchart software includes the wide flowchart examples package.
Picture: Basic Flowchart Examples
Related Solution:
Accounting flowchart is a pictorial way to represent the flow of data in an organization and the flow of transactions process in a specific area of its accounting or financial department. Accounting Flowcharts solution contains the full set of standardized accounting flowchart symbols which will help you design in minutes various types of Accounting Flowcharts including such popular diagrams which represent the whole accounting process: Purchasing Flowchart, Receiving Flowchart, Voucher Payable Flowchart, Treasurer Flowchart, Payment Flowchart.
Picture: Accounting Flowchart Purchasing Receiving Payable and Payment
Related Solution:
This sample was created in ConceptDraw DIAGRAM diagramming and vector drawing software using the Business Process Diagram Solution from the Business Processes area of ConceptDraw Solution Park. The Business Process Solution is based on the standard BPMN 2.0 and includes the set of libraries of ready-to-use objects.
Picture: BPR Diagram. Business Process Reengineering Example
Related Solution:
Two types of diagrams are used in UML: Structure Diagrams and Behavior Diagrams. Behavior Diagrams represent the processes proceeding in a modeled environment. Structure Diagrams represent the elements that compose the system.
Picture: UML Diagram Types List
Related Solution:
ConceptDraw DIAGRAM diagramming and vector drawing software extended with Sales Flowcharts solution from the Marketing area of ConceptDraw Solution Park offers the set of extensive tools for quick and easy drawing professional looking Sales Process Flowcharts.
Picture: Sales Process Flowcharts
Related Solution:
The reliability is a cornerstone for any corporate computer network. If you want to provide a high fault tolerance, a mesh network topology would be the solution. The main advantage of this network is that every node can work as a commutator, although it’s not easy to set up this kind of network.
A mesh network topology may be full, or partial. Full mesh network means that each node of the network (computer, workstation or other equipment) is connected directly to each of the other nodes. A partial mesh topology means that a part of nodes are connected with a whole network, and the other part of nodes are only connected to those equipment, they exchange the majority of data. This illustration shows schematic diagram of a partial mesh network containing six nodes. Each node is represented as a circles and connections are drawn as straight lines. The connections may be both wired and wireless. This scheme can be used to make the specific logical or physical network diagrams by means the ConceptDraw Computer and Networks solution.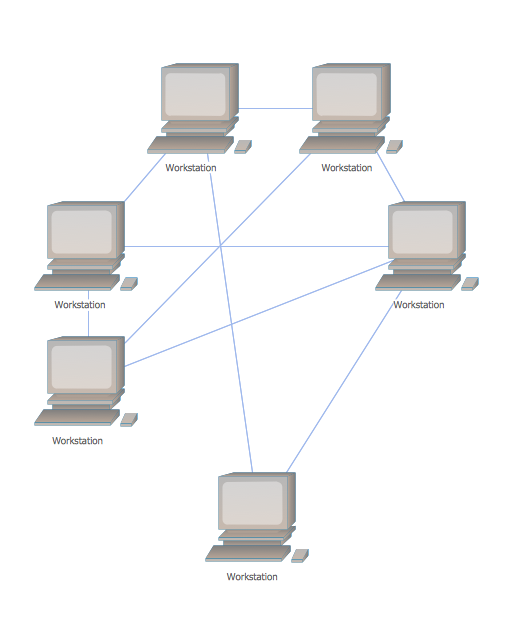
Picture: Mesh Network Topology Diagram
Related Solution:
What is a Process Flow Map? It is a chart which visually illustrates a business process and how its steps work together. Process Flow Maps help companies define problem areas, inefficient activities for the purpose of further increasing performance and profitability of businesses. ConceptDraw DIAGRAM diagramming and vector drawing software extended with Flowcharts solution from the Diagrams area of ConceptDraw Solution Park is efficient and productive software for fast and simple creating professional looking Process Flow Map.
Picture: Process Flow Maps
Related Solution:
Designing a floor plan or a home plan using special software may sound quite complicated. There are many tools to create such plan, but it would be useful for a beginner to watch some tips on how to create home plan with examples or even templates. ConceptDraw Solution Park provides dozens of floor plans examples, templates and libraries with vector stencils.
This small private apartment floor plan is created using ConceptDraw Building Plans solution. It provides the 15 object libraries that include more than 600 vector objects along with the set of templates for drawing different floor plans. The given sample represents the individual apartment's plan in details. It shows the layout of rooms, the furniture and sanitary engineering location and even possible location of houseplants. The legend on the right side of the drawing will guide people through the location of the apartment.
Picture: How To Create Home Plan with Examples
Related Solution:


