Cross Functional Flowchart
The humble flowchart is one of the more ubiquitous diagrams used when constructing or analyzing business processes. Their simple nature makes them an ideal candidate for use as a solution model to a given problem; possible subject matter is practically limitless, and they can be utilized and understood by all levels of employee throughout a company.
The basic building blocks of a flowchart are always the same — the starting and (sometimes multiple) ending points of the process flow are called 'terminals', and are shown as circles, ovals, stadiums or rounded rectangles. Decisions are described within diamond shapes, and all are connected with arrowed lines that represent the flow of control throughout the process.
It is possible to add extra layers of complexity, by utilizing specialist shapes for certain tasks, or go even further by adding what's known as 'swimlanes' — turning a flowchart into a cross-functional flowchart (also known as a swimlane diagram or deployment flowchart). A normal flowchart is a basic view of the steps in a process — by adding swimlanes, that process can then be segregated depending on which of an organization's departments is responsible for certain steps.
ConceptDraw DIAGRAM extended with Cross-Functional Flowcharts Solution from the Business Processes Area is the best software for quick and easy designing Cross Functional Flowchart of any complexity. Make sure in it right now!

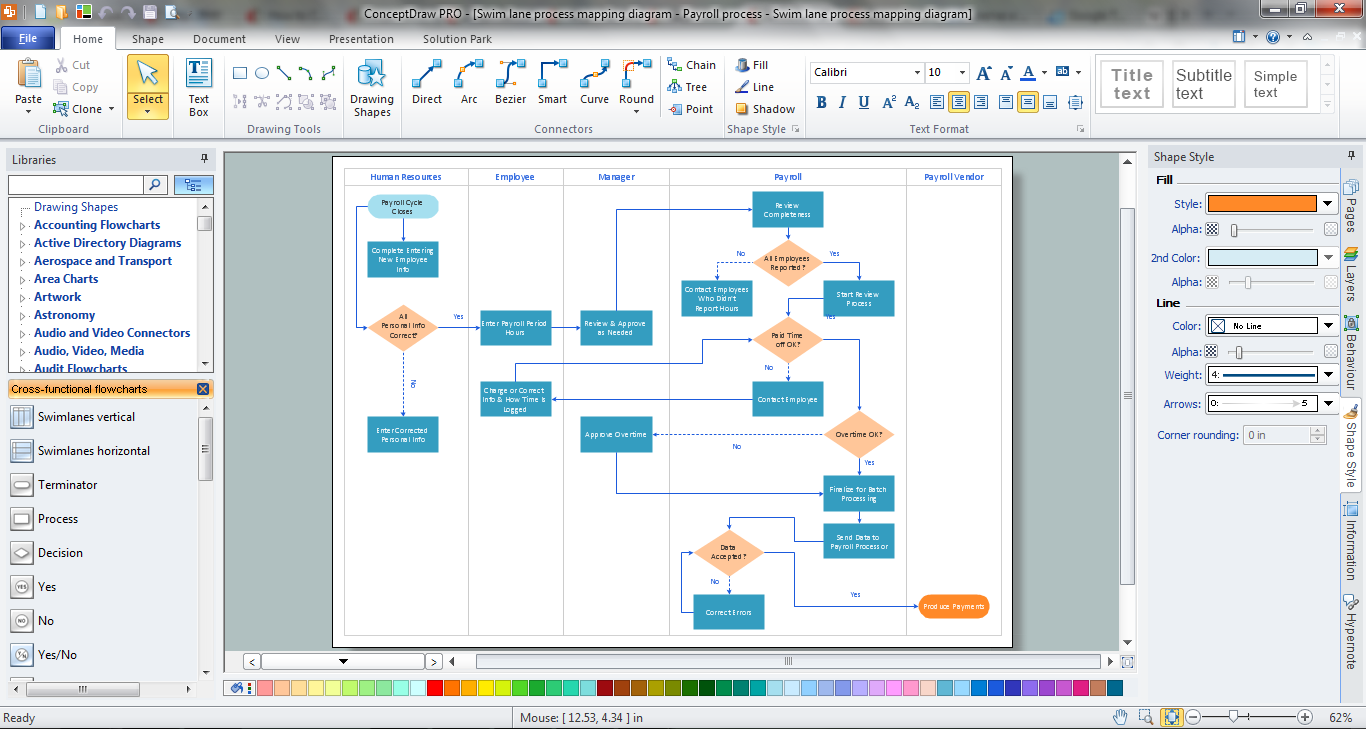
Example 3. Cross Functional Flowchart in ConceptDraw DIAGRAM
Cross-Functional Flowcharts Solution offers you the best numerous collection of predesigned Cross Functional Flowchart examples, samples and templates, and Cross-Functional Flowcharts library with large quantity of ready-to-use vector stencils.

Example 4. Cross-Functional Flowcharts Library Design Elements
These ready-to-use shapes will help you design any professional looking Cross Functional Flowchart in a few minutes. Simply drag the desired shapes from the library to your document and arrange them according to your needs.

Example 5. Cross Functional Flowchart - Payroll Process
This Cross Functional Flowchart was created in ConceptDraw DIAGRAM using the Cross-Functional Flowcharts Solution. It visually shows the steps of the Payroll Process and interconnections between them. An experienced user spent 25 minutes creating this sample.
Use the Cross-Functional Flowcharts Solution for ConceptDraw DIAGRAM to create your own professional looking and attractive Cross Functional Flowchart of any complexity quick, easy and effective.
All source documents are vector graphic documents. They are available for reviewing, modifying, or converting to a variety of formats (PDF file, MS PowerPoint, MS Visio, and many other graphic formats) from the ConceptDraw STORE. The Cross-Functional Flowcharts Solution is available for all ConceptDraw DIAGRAM or later users.
TEN RELATED HOW TO's:
Target Diagram is a convenient and visual way of presentation information which is popular and widely used in marketing, business and economics. ConceptDraw DIAGRAM diagramming and vector drawing software extended with Target and Circular Diagrams solution from the Marketing area of ConceptDraw Solution Park is ideal for fast and easy drawing a Target Diagram.
Picture: Target Diagram
Related Solution:
When we start to speak about databases, we must always mention database structure visualization. One of the most common ways to do it is to create an entity relationship diagram, and to put appropriate symbols on it. It is important either for database projecting and for its' future maintenance.
Entity Relationship Diagram describes data elements and their relationships within a database. There are a set of special symbols that depict each element of an entity relationship diagram. Entities - represents some stable components such as supplier, employee, invoice, client, etc. Relation symbols show how the entities interact. Attributes define characteristics of the relationships. Attributes can be one-to-one or many-to-many. Physical symbols is used in the physical models. They represent items such as fields, tables, types and keys. ERD physical symbols are the building material for the database. Notation lines are used to illustrate the relationships. The most common method is Crow’s Feet notation. You can use ConceptDraw Entity-Relationship Diagram (ERD) solution to represent a database using the Entity-Relationship model.
Picture: Entity Relationship Diagram Symbols
Related Solution:
The behavior of worker in organization is influences organizational effectiveness. A simple block diagram made with ConceptDraw Block diagrams solution can improve the understanding of expectations of workers regarding what they l contribute to organization and what they wait to obtain. Making block diagram depicting the individual behavior in organization is used in HR management to obtain an optimal and positive overall contribution to the organization.
The behavior of worker in organization is influences organizational effectiveness. A simple block diagram made with ConceptDraw Block diagrams solution can improve the understanding of expectations of workers regarding what they l contribute to organization and what they wait to obtain. Making block diagram depicting the individual behavior in organization is used in HR management to obtain an optimal and positive overall contribution to the organization.
Picture: Basic Diagramming
Related Solution:
To describe the accounting processing use ConceptDraw Flowchart set of symbold created for Accounting data processing.
Tips, Methods and Symbols on How to Create Flowcharts for an Accounting Information System.
Picture: How Do You Make An Accounting Process Flowchart?
Related Solution:
Sometimes it’s quite useful to look on a problem from another view. To gain insight into an obstacle you should use SWOT analysis, and this will help you to see the whole situation. When composing a SWOT matrix, you divide your problem onto four elements - strengths, weaknesses, opportunities and threats and place them into matrix.
This sample SWOT analysis matrix of the athletic shoes producing company was designed on the base of template provided by ConceptDraw SWOT and TOWS Matrix Diagrams solution. It delivers number of easy-to-use templates and samples of SWOT and TOWS matrices for ConceptDraw DIAGRAM. Applying one of these templates, enables to quickly find out Strengths, Weaknesses, Opportunities, and Threats. After creating a list managers can consider methods the business can use to amplify strengths and to decrease weaknesses; realize opportunities; and avoid threats.
Picture: SWOT Analysis
Related Solution:
ConceptDraw DIAGRAM is a flowchart creating software. This software includes over 20 vector stencils in libraries. These objects allow you to create well-designed flowcharts.
Put an initial object from library to a page and use RapidDraw technology clicking on direction arrows to add new objects to the flowchart. This way you can make flowchart quickly.
Picture: How To Create a Flow Chart in ConceptDraw
Related Solution:
Describing a workflow or approval process can take hours and be too complicated, especially since there are options to do it quickly and vividly. Diagrams called flowcharts replace long paragraphs of boring text and represent information in a graphic way. You can draw one on paper or you can use flowchart software to do it quickly and scalable. This kind of software is easy to use and you don’t need any special skills to start using it. In addition, there are a lot examples and predesigned templates on the Internet.
Flowcharts are a best tool for staking out a huge and complex process into some small readable parts. Surely, flowcharts can be drawn manually but the use of standard symbols that make it clear for a wide audience makes a software tool preferred for this task. The core for a successful flowchart is its simplicity. That is why often before beginning making flowchart through software, people draw the sketch on a piece of paper. Designing an effective flowchart means the combination of the data needed to be shown and the simplicity with which you depict it.
Picture: Flowchart Software
Related Solution:
If you have a small budget to design a computer network, you have to be very careful. One of the most cheap technologies to implement is a bus network topology, however it has many disadvantages. For instance, if the network cable is somehow damaged, the entire network won't work.
This diagram illustrates a so-called "Bus" network topology. This type of network arrangement means that each computer or other device is linked to a main link (bus). The end nodes are shown as a circle. The links to the bus are depicted as solid vertical lines. The bus is shown as a bold horizontal line. This diagram can serve as a template for creating logical or physical network diagrams. The set of vector libraries supplied with ConceptDraw Computer and Networks solution contains the symbols of all LAN and WLAN elements required for creating network diagrams of any configuration.
Picture: Bus Network Topology
Related Solution:
In order to be successful, you have to promote your business on the market. One of the ways for planning this promotion is to create a social media DFD Flowchart which will contain all the details of your business strategy. Social media is a very influential tool, and it's a mistake to ignore it.
The following flowchart represents a best way to estimate social media posts, and gives a strategy of responses. This flowchart is designed in the format of cross-functional flowchart. With this format, we can divide the process into three distinct phases. This approach helps to generate well-considered and balanced response on social networks activities. Using ConceptDraw solution for Social Media Response, your reaction to social media posts will positively mirror the values and mission of your business.
Picture: How to Create a Social Media DFD Flowchart
Related Solution:
This sample was created in ConceptDraw DIAGRAM diagramming and vector drawing software using the UML Class Diagram library of the Rapid UML Solution from the Software Development area of ConceptDraw Solution Park.
This sample describes the use of the classes, the generalization associations between them, the multiplicity of associations and constraints. Provided UML diagram is one of the examples set that are part of Rapid UML solution.
Picture: UML Class Diagram Generalization ExampleUML Diagrams
Related Solution:
 Providing Telecom Services
 Credit Approval Process
 Trading Process Diagram
 Cross-Functional Horizontal Template
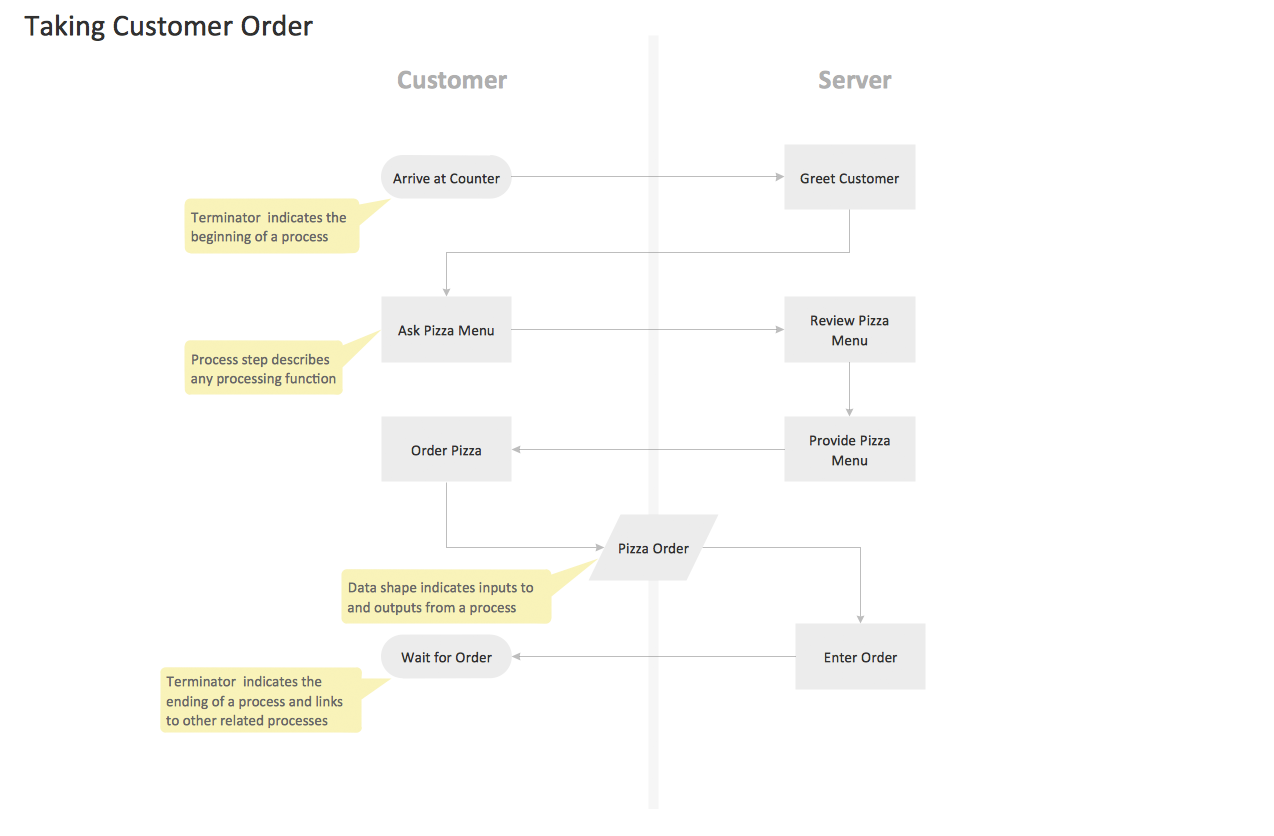 Cross-Functional Vertical Template
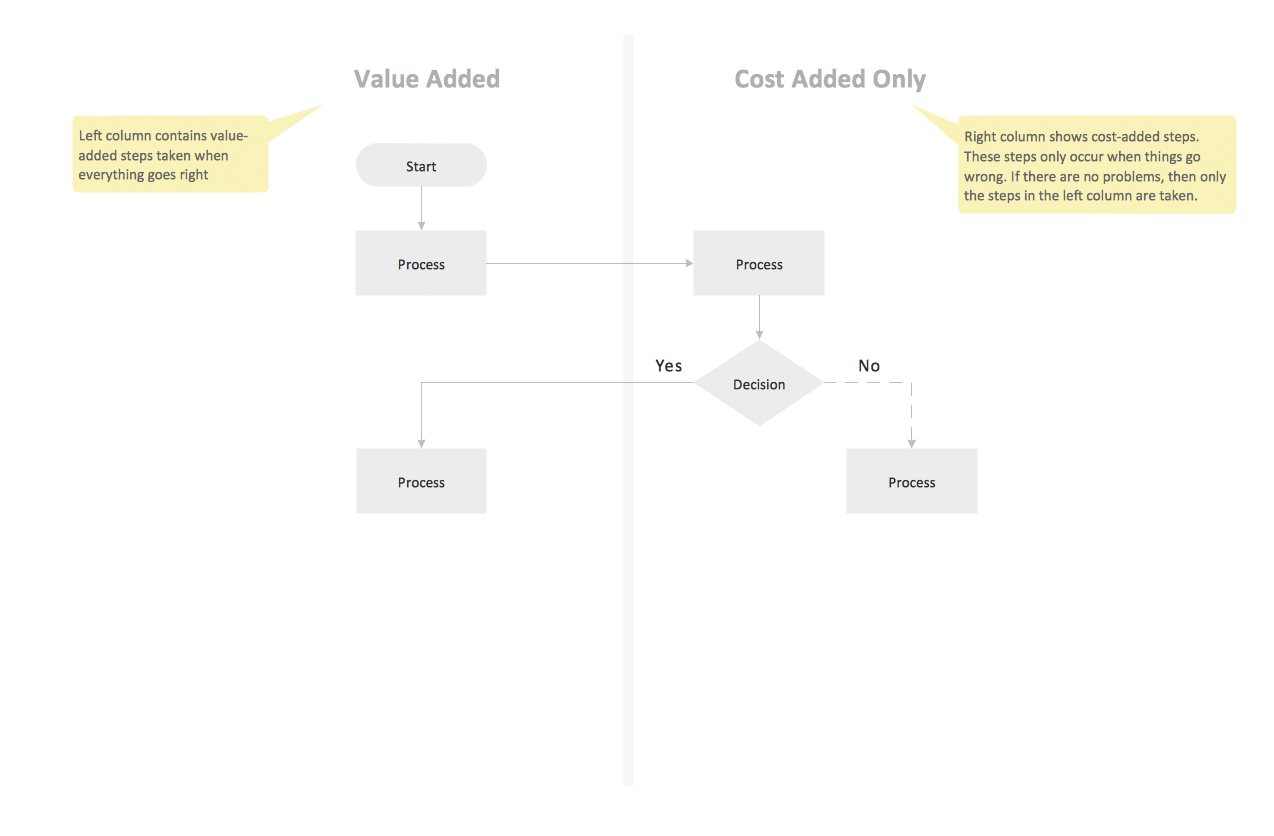 Opportunity Flowchart Template
