Cisco Routers. Cisco icons, shapes, stencils and symbols
Developing a network design, one should take into account the potential number of users, required interfaces, communication channels and then create a network map and an IP plan. You should also try to stick to the hierarchical network model, which has many advantages. First of all, it is the clarity of the network's organization. Also, the model implies modularity, which means easy capacity building if needed.
Another advantage is the increased resiliency which is achieved due to the duplication of devices or connections. According to this model, the network is divided into three logical layers. First level is the core level. There are high-performance devices at this level, such as routers, which main task is to transport data. This is followed by distribution level which provides the use of security policies, QoS, link aggregation and VLAN trunking, defines broadcast domains. The final level is the access level, the purpose of which is to connect the end devices, to mark traffic for the QoS, to implement ring protection(STP) and broadcast storm protection, to providing power to PoE devices.
The Cisco Network Diagrams solution uses Cisco network symbols and Cisco icons to visualize computer networks topology and equipment connections and arrangement. They are used by IT professionals and corporate IT departments, and network and system administrators, to visually document the topology and design of Cisco networks.
The ConceptDraw vector stencils library "Cisco Routers" contains 27 equipment symbols for drawing the computer network diagrams using the ConceptDraw DIAGRAM diagramming and vector drawing software:
- Router
- Router, subdued
- Router with silicon switch
- Wavelength router
- NetFlow router
- uBR910
- Broadband router
- Gigabit switch ATM tag router
- ATM tag switch router
- Edge label switch router
- Edge label switch router with NetFlow
- Cisco 7505
- Cisco 7507
- Cisco 7500 ARS (7513)
- Voice enabled router
- TDM router
- IP telephony router
- IAD router
- Content service router
- Cisco storage router
- Router with firewall
- Wireless router
- ASR 1000 series
- ATM 3800
- AXP
- Cable modem
- Ground terminal
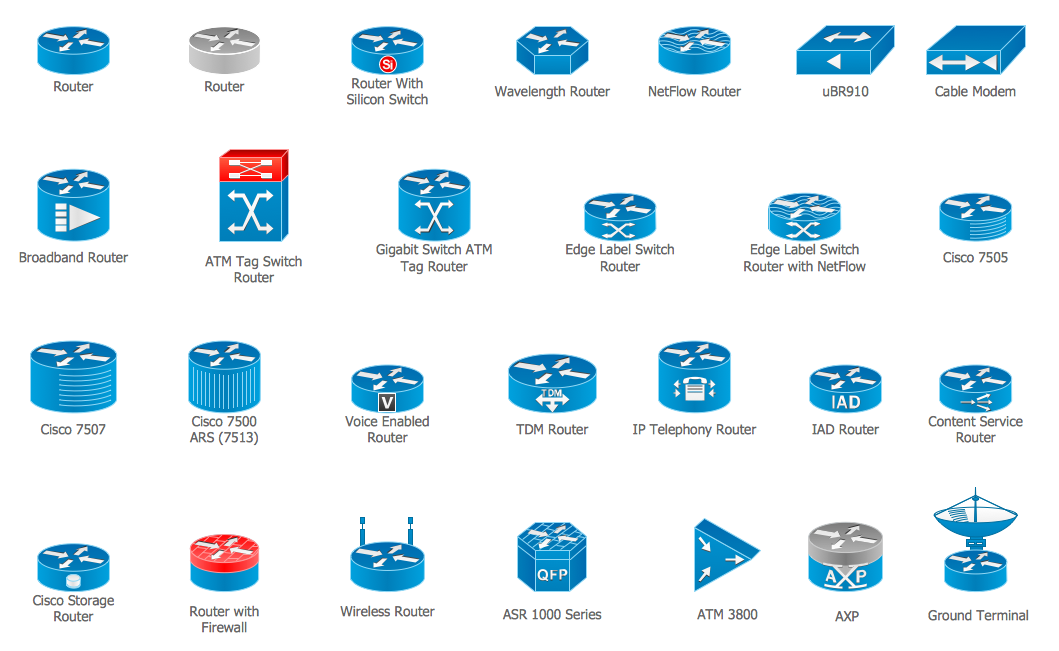

Sample 1. Design Elements — Cisco Routers (macOS, Windows) for Network Diagrams. Network equipment refers to hardware devices designed for local area networks, both wired and wireless. Active network equipment is powered from the electricity supply, portable battery, the computer via USB-port and other sources, also it can be used for amplification, conversion and processing of the network signal. Network equipment includes several device categories. Internal and external network adapters are used to connect to the network. Switches connect network nodes. Routers connect multiple network segments and filter traffic. Repeaters and amplifiers increase the range of action of the network signal. Media converters and transceivers convert the network signal from one type to another. Access points provide wireless access to an existing network or create a new wireless network. GSM-modems and gateways used to work with wireless GSM / GPRS / EDGE / UMTS / HSPA / LTE-networks.
The example "Design elements — Cisco Routers" is included in the Cisco Network Diagrams solution from the Computer and Networks area of ConceptDraw Solution Park.

Example 2. Cisco Network Diagrams solution
Icons, shapes, stencils, symbols and design elements for Cisco Network Diagrams:
TEN RELATED HOW TO's:
Describing a workflow or approval process can take hours and be too complicated, especially since there are options to do it quickly and vividly. Diagrams called flowcharts replace long paragraphs of boring text and represent information in a graphic way. You can draw one on paper or you can use flowchart software to do it quickly and scalable. This kind of software is easy to use and you don’t need any special skills to start using it. In addition, there are a lot examples and predesigned templates on the Internet.
Flowcharts are a best tool for staking out a huge and complex process into some small readable parts. Surely, flowcharts can be drawn manually but the use of standard symbols that make it clear for a wide audience makes a software tool preferred for this task. The core for a successful flowchart is its simplicity. That is why often before beginning making flowchart through software, people draw the sketch on a piece of paper. Designing an effective flowchart means the combination of the data needed to be shown and the simplicity with which you depict it.
Picture: Flowchart Software
Related Solution:
Computer networks nowadays are spread all across the world. The large number of parameters, such as geographic scale or communication protocols, can divide networks. One of the most common types of networks is called local area network (LAN). It convenient to represent network examples by means of diagrams.
This local area network (LAN) diagram provides an easy way to see the way the devices in a local network are interacted. The diagram uses a library containing specific symbols to represent network equipment , media and the end-user devices such as computers (PC, mac, laptop) , network printer, hubs, server and finally a modem. There are two types of network topologies: physical and logical. The current diagram represents precisely a physical type of LAN topology because it refers to the physical layout of a local network equipment.
Picture: Local area network (LAN). Computer and Network Examples
Related Solution:
A flowchart is a simple but very functional tool when it comes to understanding a workflow or to removing unnecessary stages from a process. When drawing flowcharts, keep in mind that there are four common types of flowcharts, like document flowcharts and data flowcharts that show control over a data or document flow over a system. To show controls on a physical level, use system flowcharts. In addition, to show controls in a program, you can draw a program flowchart.
This flowchart diagram represents the piece of an article editing process, that involves the author and editor. It was created using the Basic Flowchart notation that consists from the basic flowchart symbols. The start and the end of the process are indicated with "Terminator" symbols. The "Process" symbols show the action steps consisting from making edits and searching for a compromise, when the author does not agree with the suggestions of the editor. The "Process" symbol is the general symbol in process flowcharts. The "Decision" symbol indicates a branching in the process flow. There are two branches indicated by a Decision shape in the current flowchart (Yes/No, Disagree/Agree). This basic flowchart can be used as a repeating unit in the workflow diagram describing the working process of some editorial office.
Picture: Types of Flowcharts
Related Solution:
Computer and Networks solution provides the libraries with large quantity of predesigned vector objects and the great number of templates and samples that will help design the Cable Networks in a few minutes.
Picture: Cable Network. Computer and Network Examples
Related Solution:
Electrical Engineering Solution used together with ConceptDraw DIAGRAM drawing facilities makes short a work of drawing various electrical and electronic circuit schemes. A library of vector objects composed from symbols of Analog and Digital Logic elements of electric circuit includes 40 symbolic images of logic gates, bistable switches of bi-stable electric current, circuit controllers, amplifiers, regulators, generators, etc. All of them can be applied in electronic circuit schemes for showing both analog and digital elements of the circuit.
Electrical Engineering Solution used together with ConceptDraw DIAGRAM drawing facilities makes short a work of drawing various electrical and electronic circuit schemes. A library of vector objects composed from symbols of Analog and Digital Logic elements of electric circuit includes 40 symbolic images of logic gates, bistable switches of bi-stable electric current, circuit controllers, amplifiers, regulators, generators, etc. All of them can be applied in electronic circuit schemes for showing both analog and digital elements of the circuit.
Picture: Electrical Symbols, Electrical Diagram Symbols
Related Solution:
OSPF is an interior gateway protocol (IGP), it is widely used in large enterprise networks. OSPF routes the IP packets within a single routing domain. It gathers the information about the link state from the routers and makes the network topology map.
This example was created in ConceptDraw DIAGRAM using the Computer and Networks Area of ConceptDraw Solution Park and shows the OSPF diagram.
Picture: OSPF Network. Computer and Network Examples
Related Solution:
How to describe the necessity of using network security devices and visually illustrate this information? Now, it's very easy thanks to the ConceptDraw DIAGRAM diagramming and vector drawing software extended with Network Security Diagrams Solution from the Computer and Networks Area of ConceptDraw Solution Park.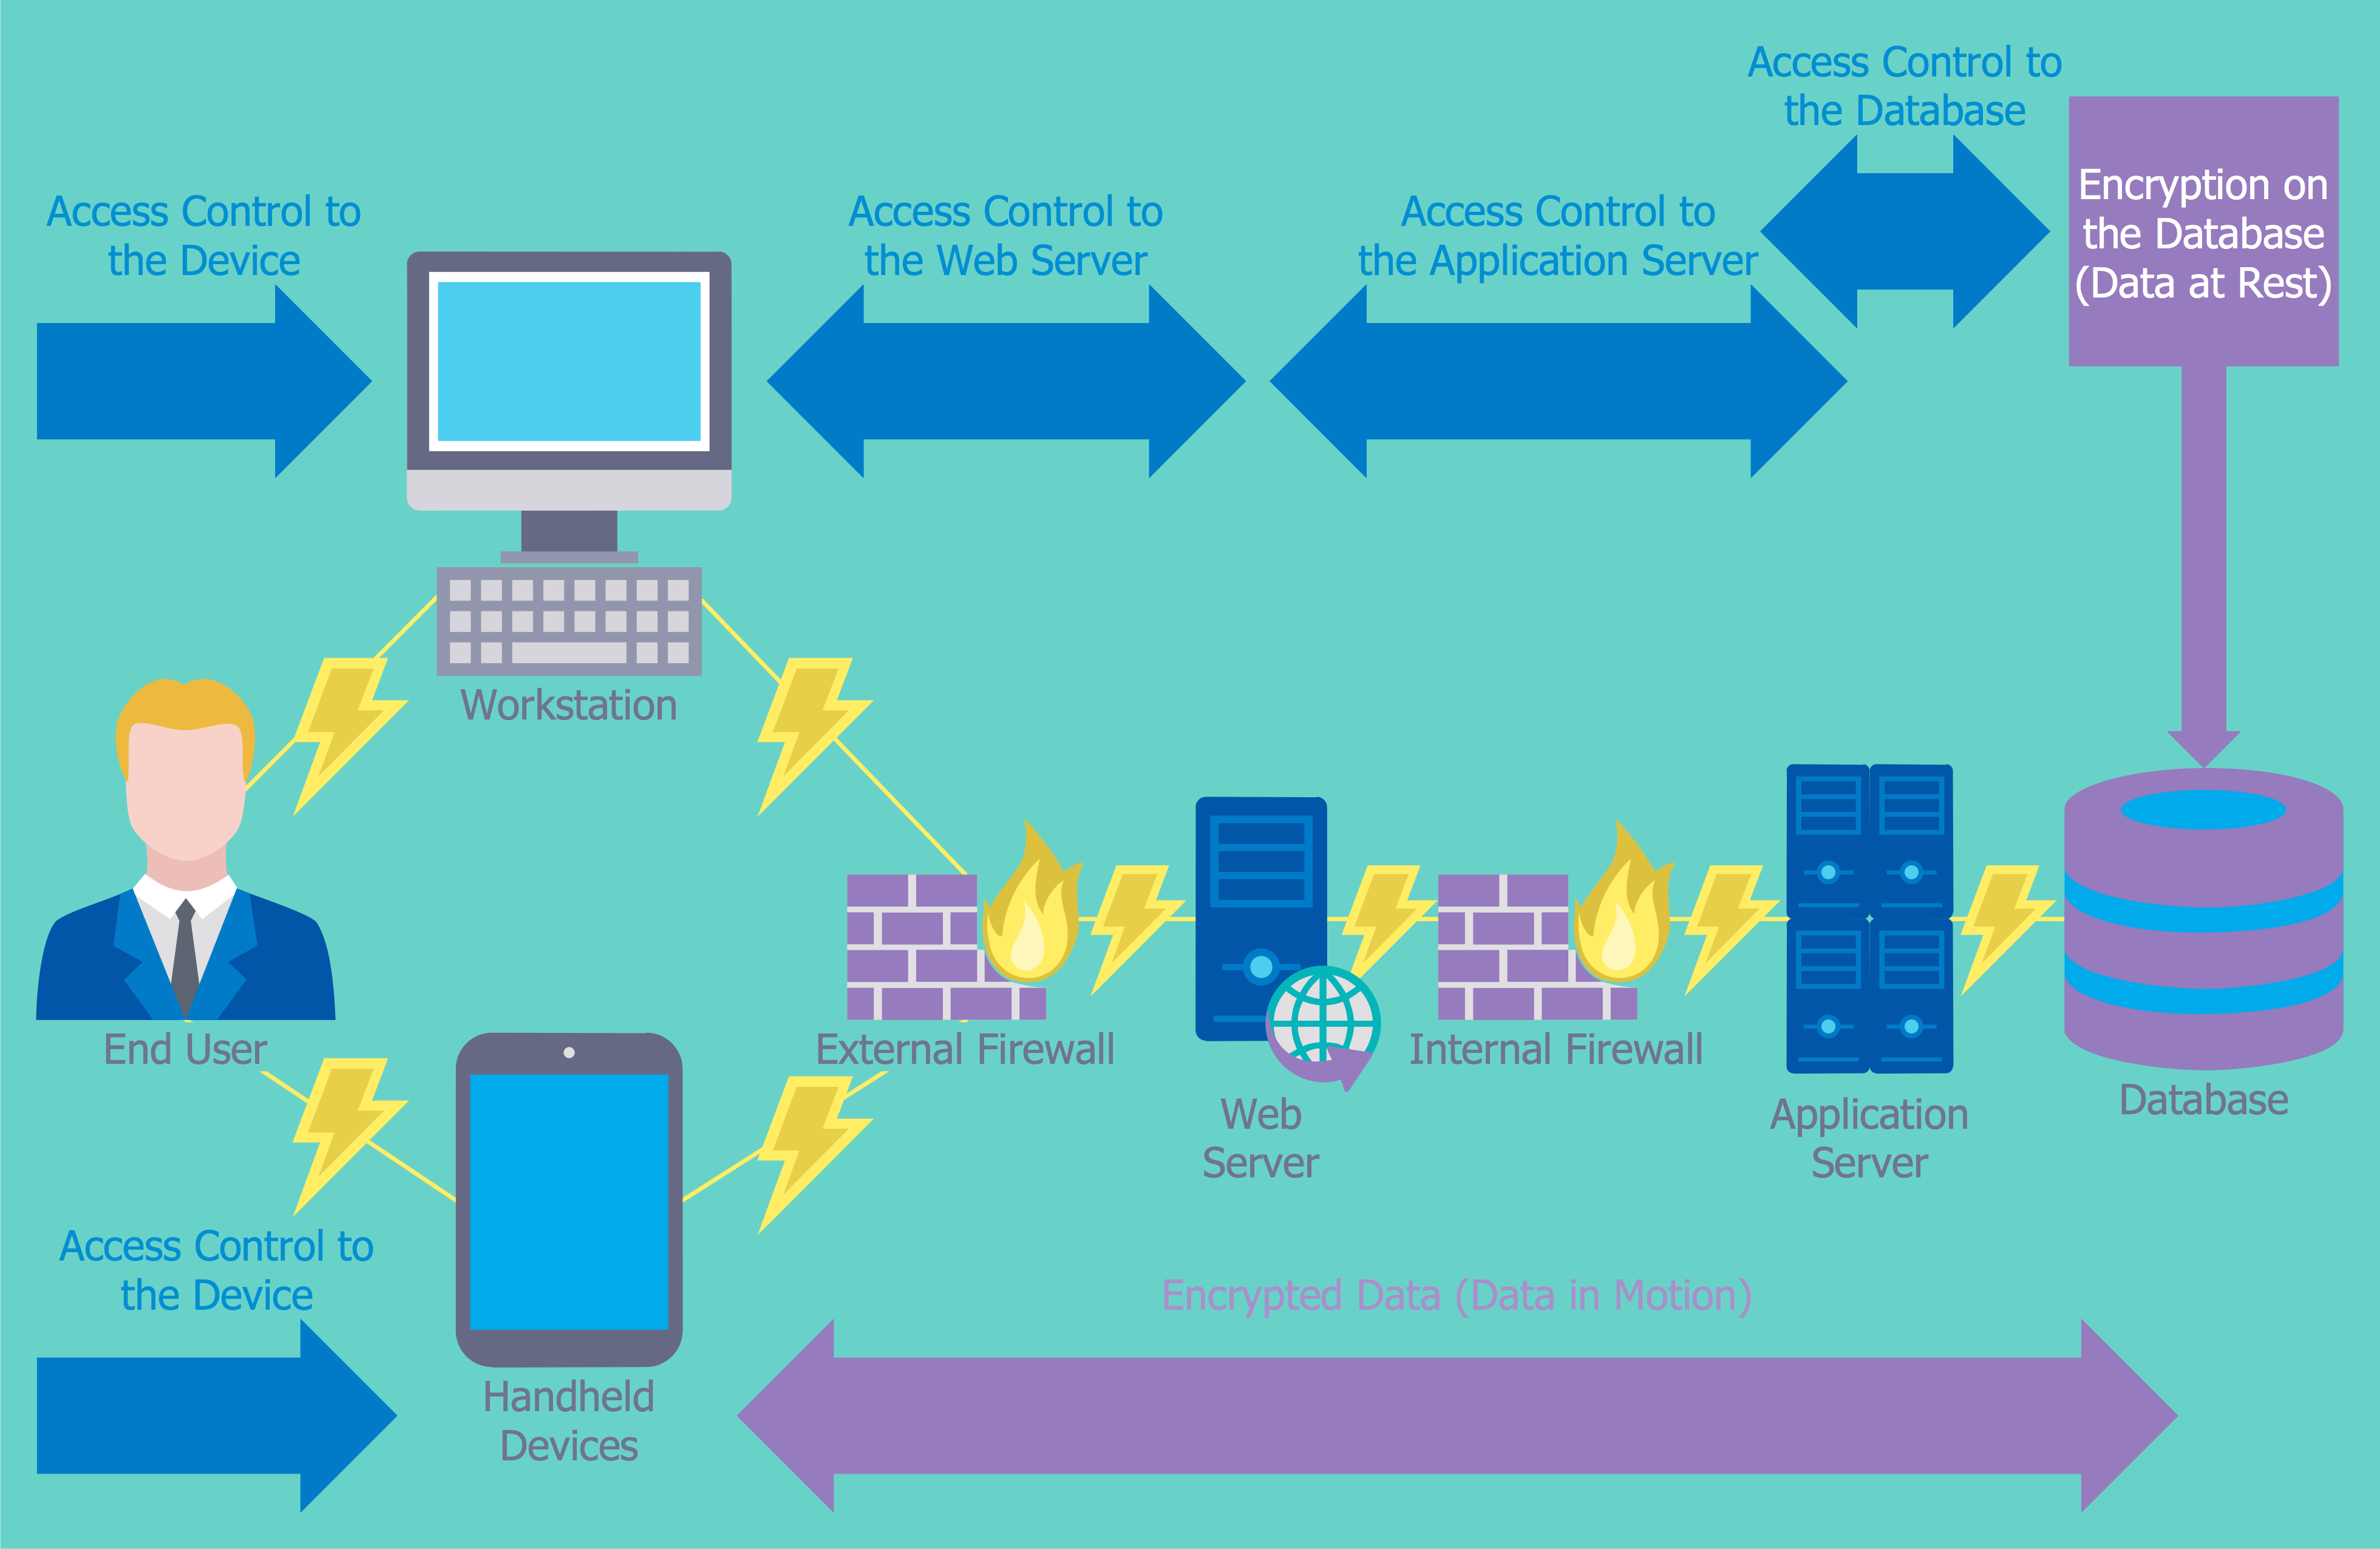
Picture: Network Security Devices
Related Solution:
A database is a data collection, structured into some conceptual model. Two most common approaches of developing data models are UML diagrams and ER-model diagrams. There are several notations of entity-relationship diagram symbols and their meaning is slightly different. Crow’s Foot notation is quite descriptive and easy to understand, meanwhile, the Chen notation is great for conceptual modeling.
An entity relationship diagrams look very simple to a flowcharts. The main difference is the symbols provided by specific ERD notations. There are several models applied in entity-relationship diagrams: conceptual, logical and physical. Creating an entity relationship diagram requires using a specific notation. There are five main components of common ERD notations: Entities, Actions, Attributes, Cardinality and Connections. The two of notations most widely used for creating ERD are Chen notation and Crow foot notation. By the way, the Crow foot notation originates from the Chen notation - it is an adapted version of the Chen notation.
Picture: ERD Symbols and Meanings
Related Solution: