Marketing Diagrams
With ConceptDraw, easily diagram complex processes that conform to particular standards such as Lean or Six Sigma. It includes a variety of business process shapes so your diagrams look exactly the way you want. Easily collaborate with colleagues to create detailed process diagrams and use them as a key element in streamlining your processes.
ConceptDraw Business Diagram Suite is the most powerful business and relational charting/diagramming package available. If you need to create advanced, completely customizable Flow Charts, Organizational charts and other relational diagrams from your data, then ConceptDraw is the ideal solution for you.
Examples of functionality that ConceptDraw Business Diagram is perfectly suited for include:
- Creating Dynamic Organizational Charts
- Creating Social Network Diagrams
- Building Flow Charts and Block Charts
- Diagramming your business processes
- Decision Charts
- Much more.
Business Diagram Examples
Even users with no prior experience, may create neat and comprehensive business diagrams using ConceptDraw DIAGRAM and its Solutions.
If you need to draw professional, customizable Business Diagrams, Organizational charts and many other relational diagrams using your data, ConceptDraw DIAGRAM is the right tool for you.
What are the Benefits of Business Diagram
- Gain greater understanding of your corporate data, by visualizing business processes and acting on them.
- Dynamically create advanced, customized Organizational Charts and Diagrams on the web.
- Visually examine how people, business functions and other items relate to each other.
- Create custom, reusable objects for rapid application development.
- With just a few clicks, ConceptDraw can connect, align, and evenly distribute shapes in your business process diagrams. ConceptDraw can automatically connect shapes as you drag, drop, and rearrange them onto the drawing page, or connect existing shapes that are already on the drawing page.
Free Download Diagram Software and View All Examples

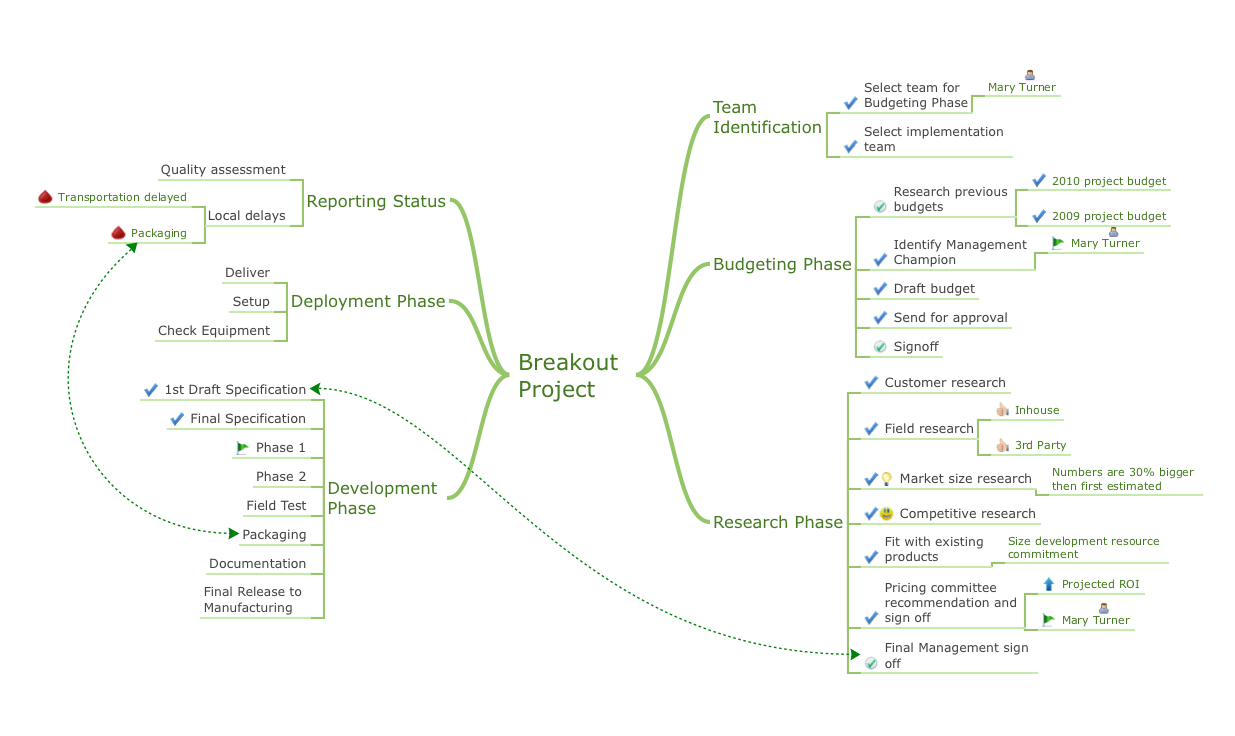
Pic. 1. Business Flowchart. Social media activity of a real estate agent.
All ConceptDraw DIAGRAM documents are vector graphic files and are available for reviewing, modifying, and converting to a variety of formats: image, HTML, PDF file, MS PowerPoint Presentation, Adobe Flash, MS Visio VSDX.
TEN RELATED HOW TO's:
You can use many tools to create a representation of a system behavior or a scheme of objects relationships. Some of them are quite abstract and useless, and some, like UML tools help clarifying both the structure and the behavior of a system. There are various types of uml diagrams and tons of examples explaining the difference between them.
UML 2.2 specification has many kinds of diagrams. They are divided into two groups( structure and behavior diagrams). This class diagram shows the hierarchical structure of UML 2.2 specification. Class diagram - the most suitable tool for this task because it is designed to describe basic structure of a system. This diagram can be use as a visual aid for learning UML.
Picture: UML Tool & UML Diagram Examples
Related Solution:
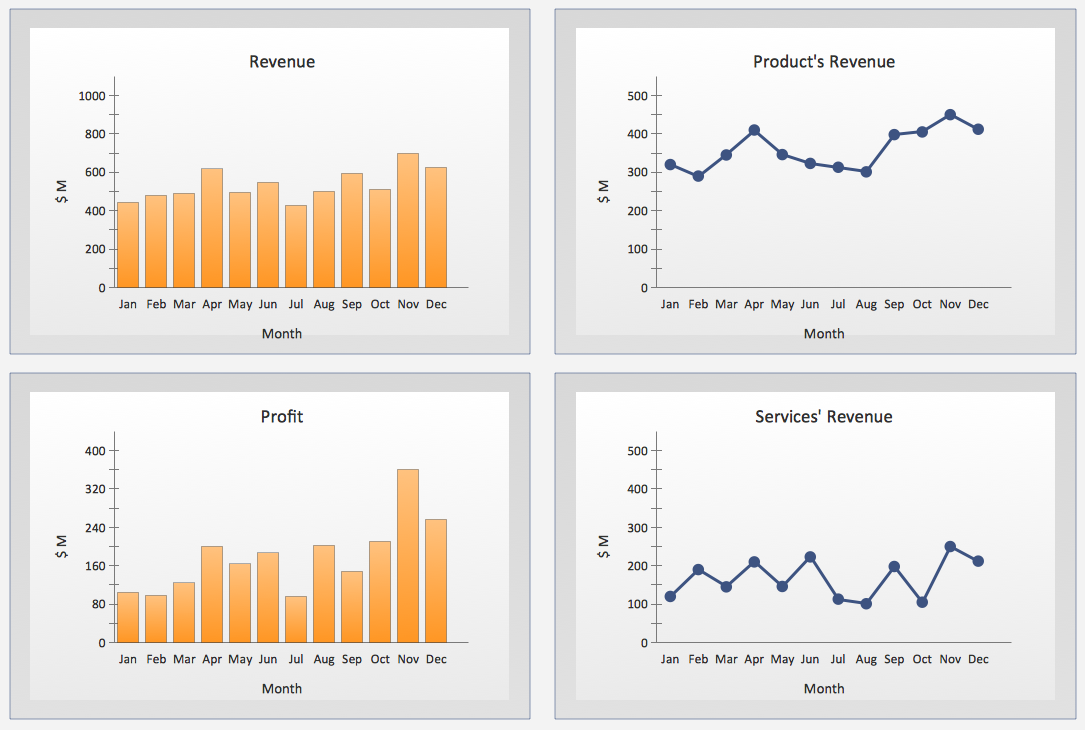
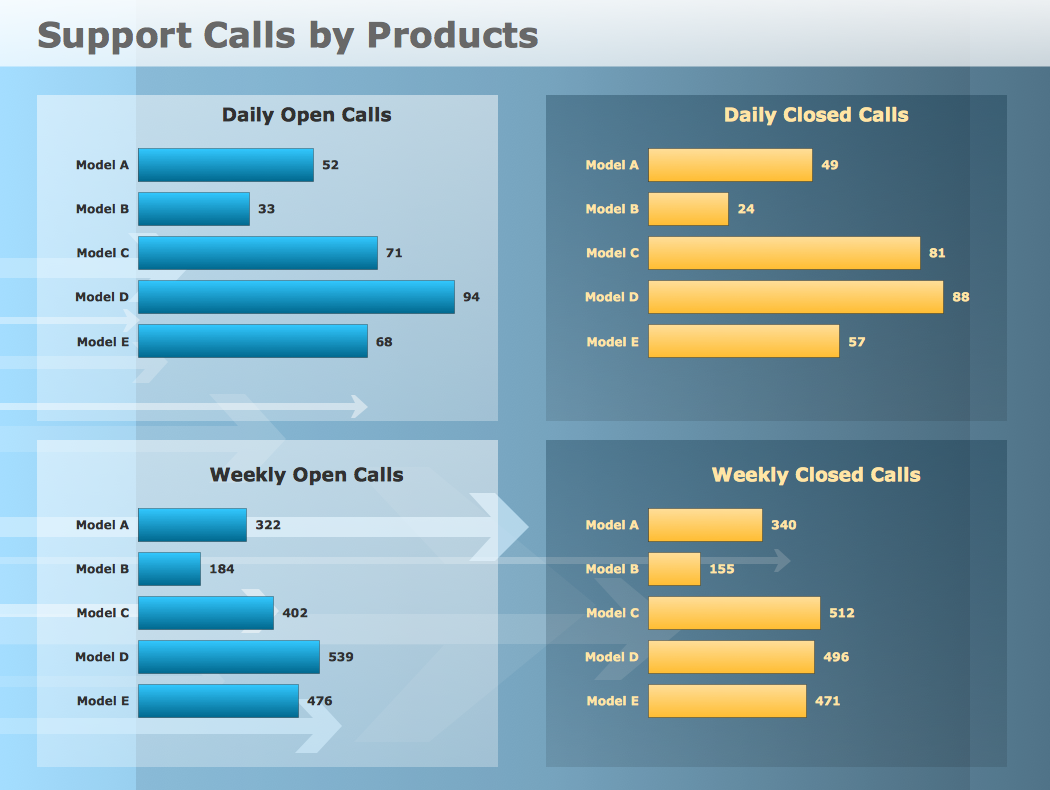
Using professional reporting and data visualization is the way your business can improve. ConceptDraw Sales Dashboard solution allows you produce live dashboards show KPI to monitor you sales activity and results in real time.
Picture: Reporting & Data Visualization
To begin managing a new project, you will need to define the individual Tasks that must be completed to deliver it. The default view for a new project in ConceptDraw PROJECT is the Gantt Chart.
Picture: How to Create Gantt Chart
ConceptDraw DIAGRAM diagramming and vector drawing software offers the Fault Tree Analysis Diagrams Solution from the Industrial Engineering Area of ConceptDraw Solution Park for quick and easy creating the Fault Tree Diagram of any degree of detailing.
Picture: Fault Tree Diagram
Related Solution:
ConceptDraw DIAGRAM enhanced with Flowcharts Solution is the best flow chart maker online design software. Use it to ✔️ create clear and actionable Flowcharts, ✔️ improve decision-making, ✔️ enhance problem-solving in various scenarios, ✔️ enhance creativity and productivity across industries, ✔️ streamline workflows
Picture: Flow Chart Online
Related Solution:
Processing Flow Chart is a simplified sketch used in chemical and process engineering to illustrate general plant streams, major equipment, and key control loops. ConceptDraw DIAGRAM enhanced with Flowcharts Solution is ideal software for designing ✔️ Processing Flow Charts, ✔️ Process Flow Charts, ✔️ Flow Chart Process Maps
Picture: Processing Flow Chart
Related Solution:
The ConceptDraw Flowchart component includes a set of samples and templates. This geathered as flowchart maker toolbox which focused on drawing flowcharts of any industry standards.
Picture: Flowchart Components
Related Solution:
ConceptDraw Flowcharts visualize a process or algorithm of program as step/operation blocks of various shapes connected with arrowed lines showed the process flow direction. They are used to visualize business or technical processes and software algorithms.
Picture: Selecting & Creating Flowcharts
Related Solution:
Use ConceptDraw DIAGRAM diagramming and business graphics software to draw your own flowcharts of computer algorithms.
Picture: Process Flow app for macOS
Related Solution:
ConceptDraw offers you a number of ready-made organizational chart templates which you can use in your drawing. They are grouped in topical sets as organizational chart template files.
Use the Organizational Charts Solution for ConceptDraw DIAGRAM to create your own Organizational Charts of any complexity quick, easy and effective.
The Organizational Charts designed with ConceptDraw DIAGRAM are vector graphic documents and are available for reviewing, modifying, converting to a variety of formats (image, HTML, PDF file, MS PowerPoint Presentation, Adobe Flash or MS Visio XML), printing and send via e-mail in one moment.
Picture: Organizational Chart Templates
Related Solution:
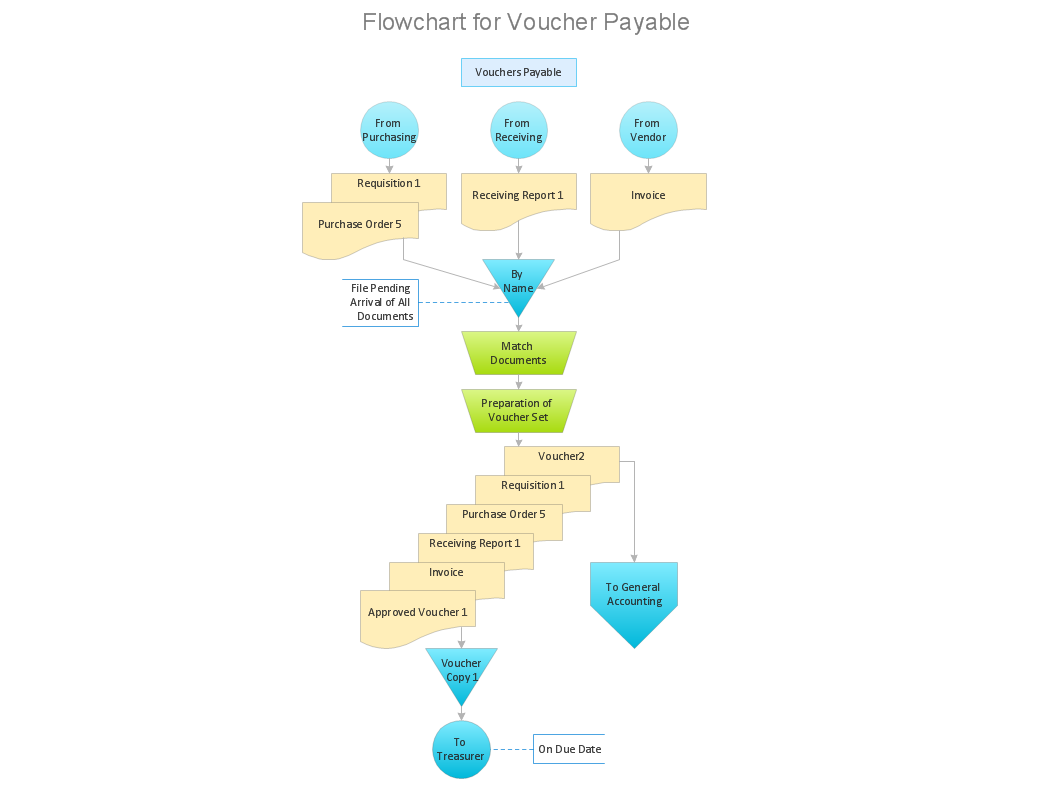 Audit Diagram
 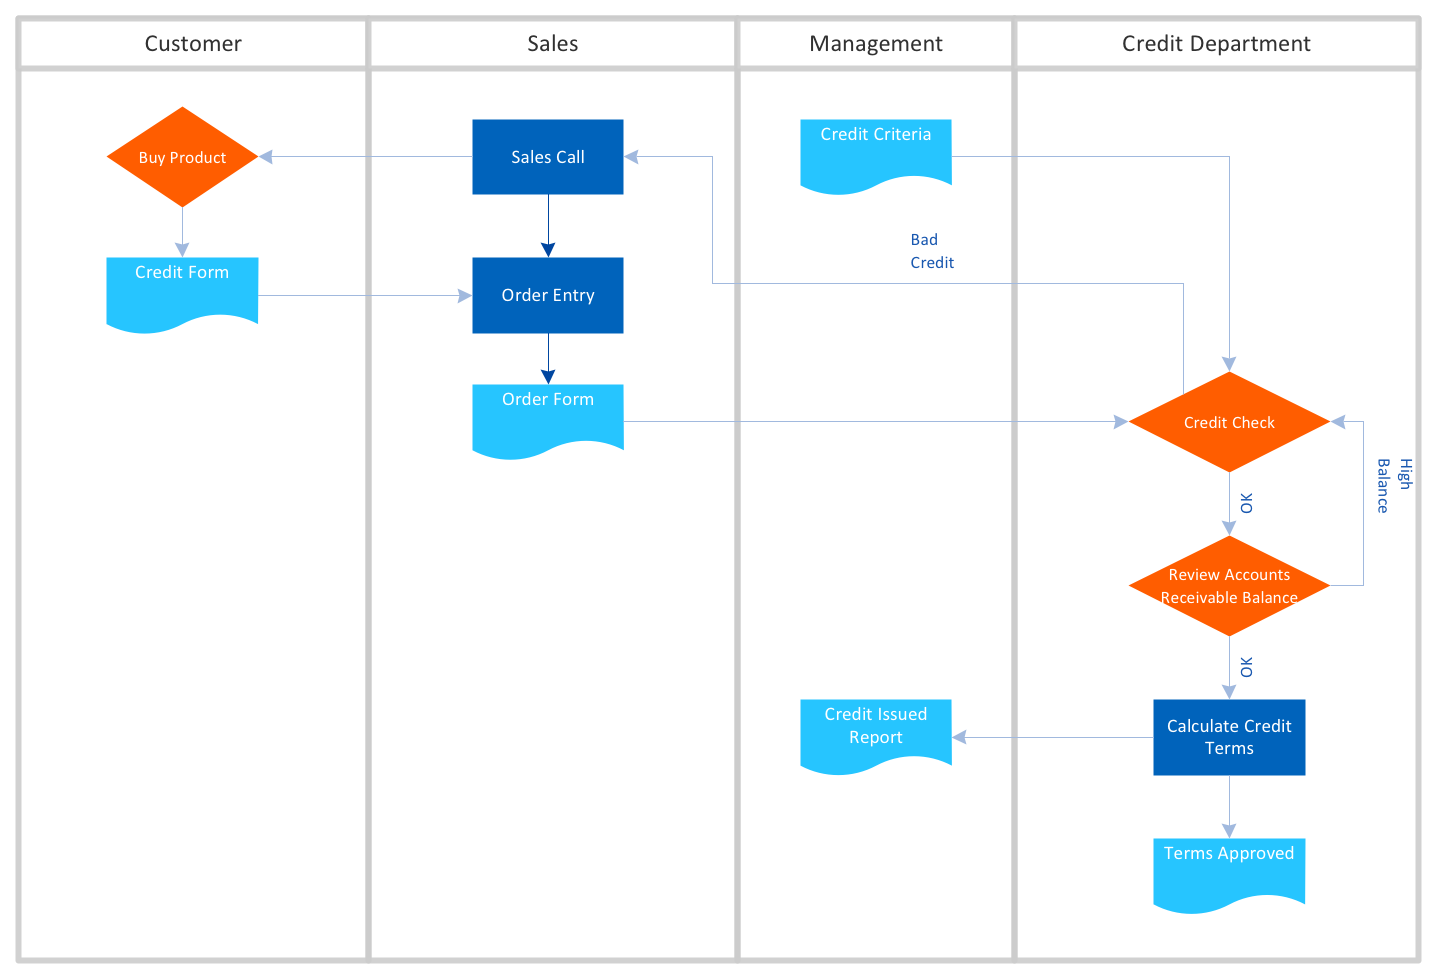 Basic Flowchart


/Diagramming-Chen-ERD-Sample61.png)