
Put your information
into a clearer picture.
Turn project data and mind maps into reports, dashboards, and business diagrams. INGYRE connects ConceptDraw OFFICE applications so you can present your work in the form your audience needs.
Three connections.
More ways to communicate.
Start with the information you already have. Choose an export or report that helps your team explore details, review progress, or explain an idea.
Explore project details.
Bring task, resource, and team information into mind map reports for a focused review.
Explore reportsMake project progress visible.
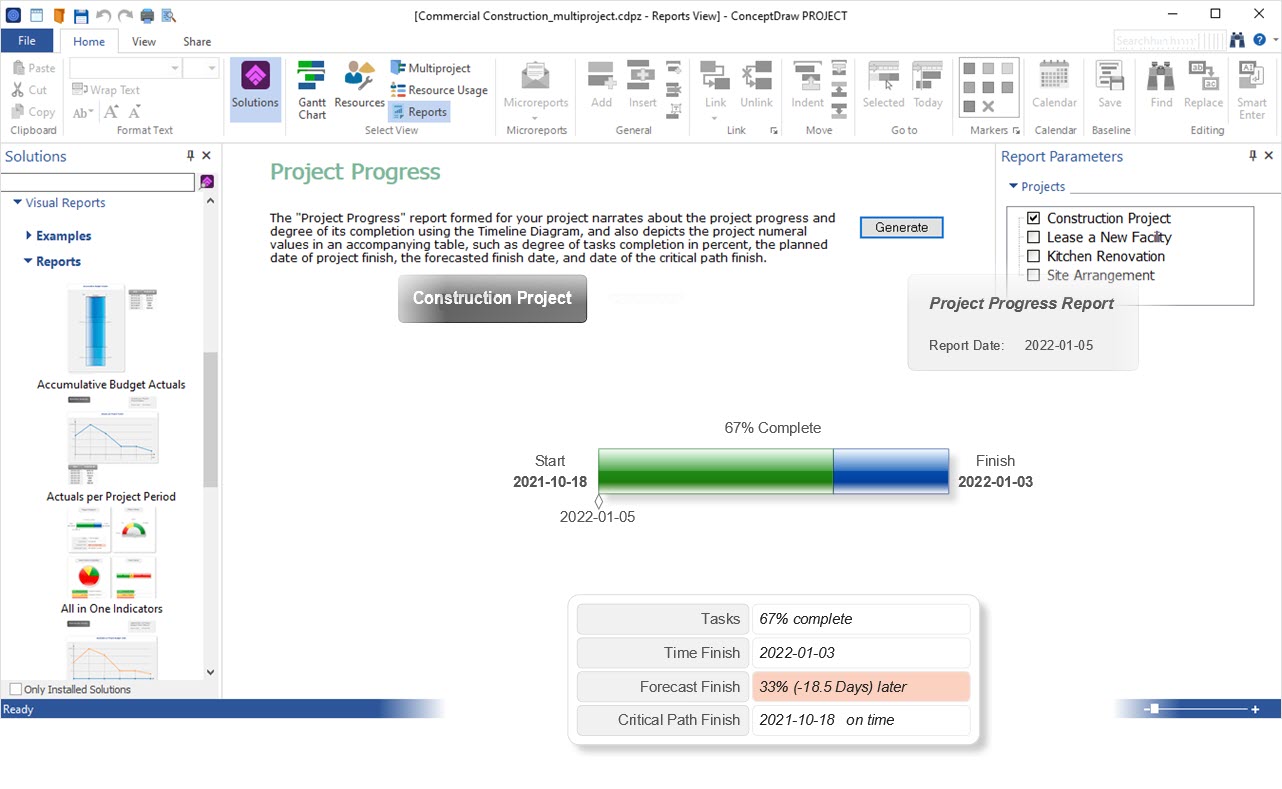
Use project diagrams, dashboards, and visual reports to share project status with stakeholders.
Explore dashboardsGive ideas a visual form.
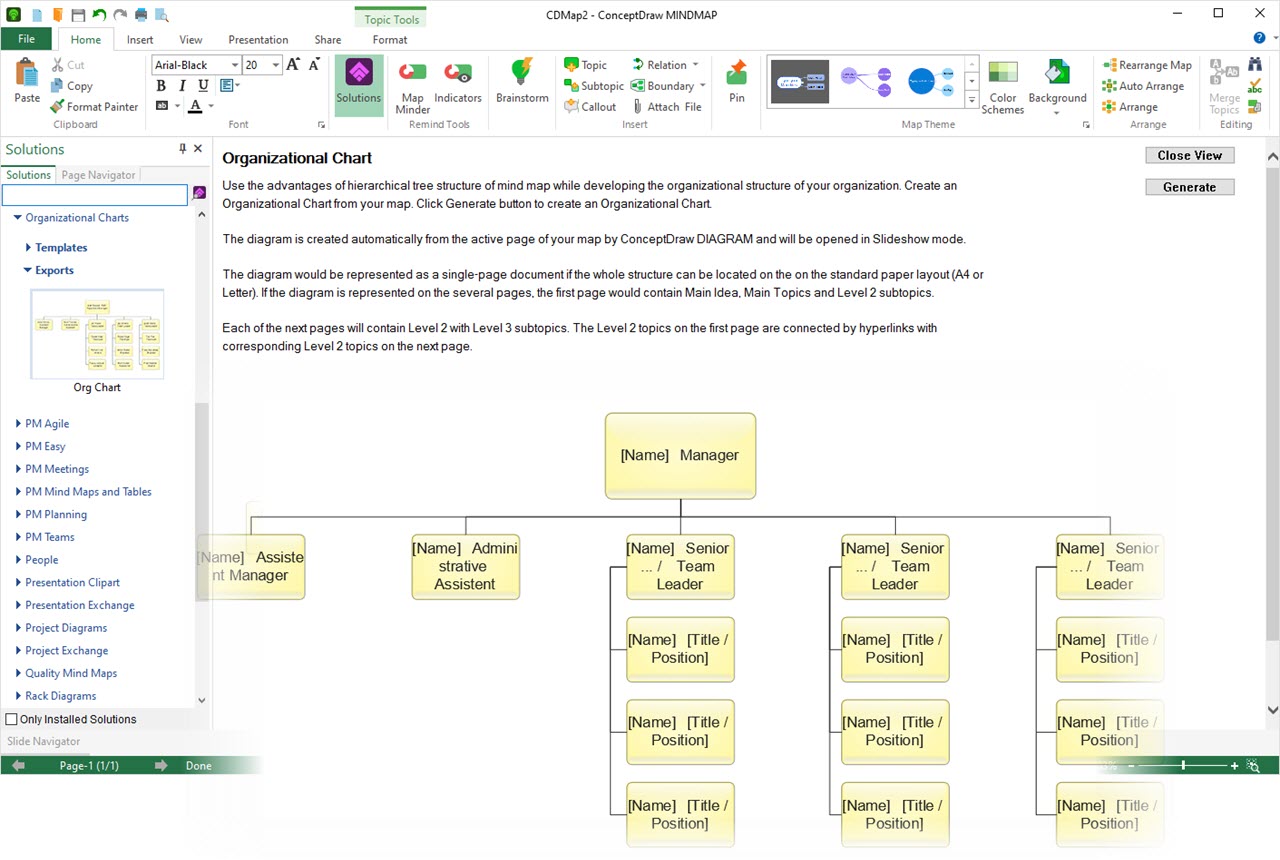
Transform map content into business diagrams or use map outlines to build presentations.
Explore diagramsStart with the question.
Choose the right view.
Need to review critical tasks, communicate progress, or examine a business problem? Define what your audience needs to understand, then select the export or report that makes that information clear.
Project information,
organized as a mind map.
The Mind Map Reports solution lets you generate reports from PROJECT for use in MINDMAP. Choose a focused view of tasks, milestones, resources, or project knowledge.
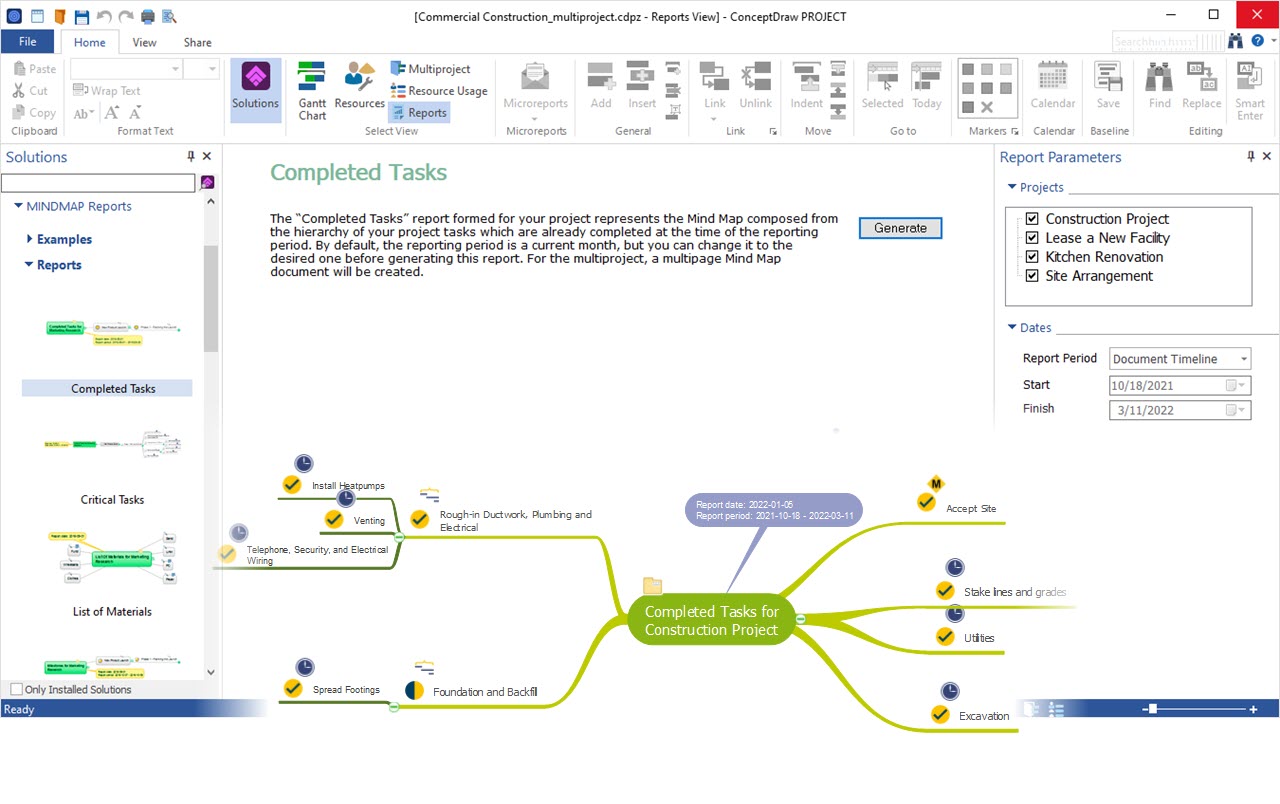
Report options include task lists, completed and critical tasks, tasks in progress, unstarted and top-level tasks, milestones, material lists, overallocated resources, project teams, project knowledge maps, and resources of knowledge.
Project progress,
ready for discussion.
Generate project diagrams and dashboards in DIAGRAM from PROJECT data. Visual reports give stakeholders and managers a clear way to review progress and discuss the state of the work.
Mind map thinking,
translated into business visuals.
Export from MINDMAP to DIAGRAM to develop presentations from map outlines or transform your map into a diagram suited to the analysis.