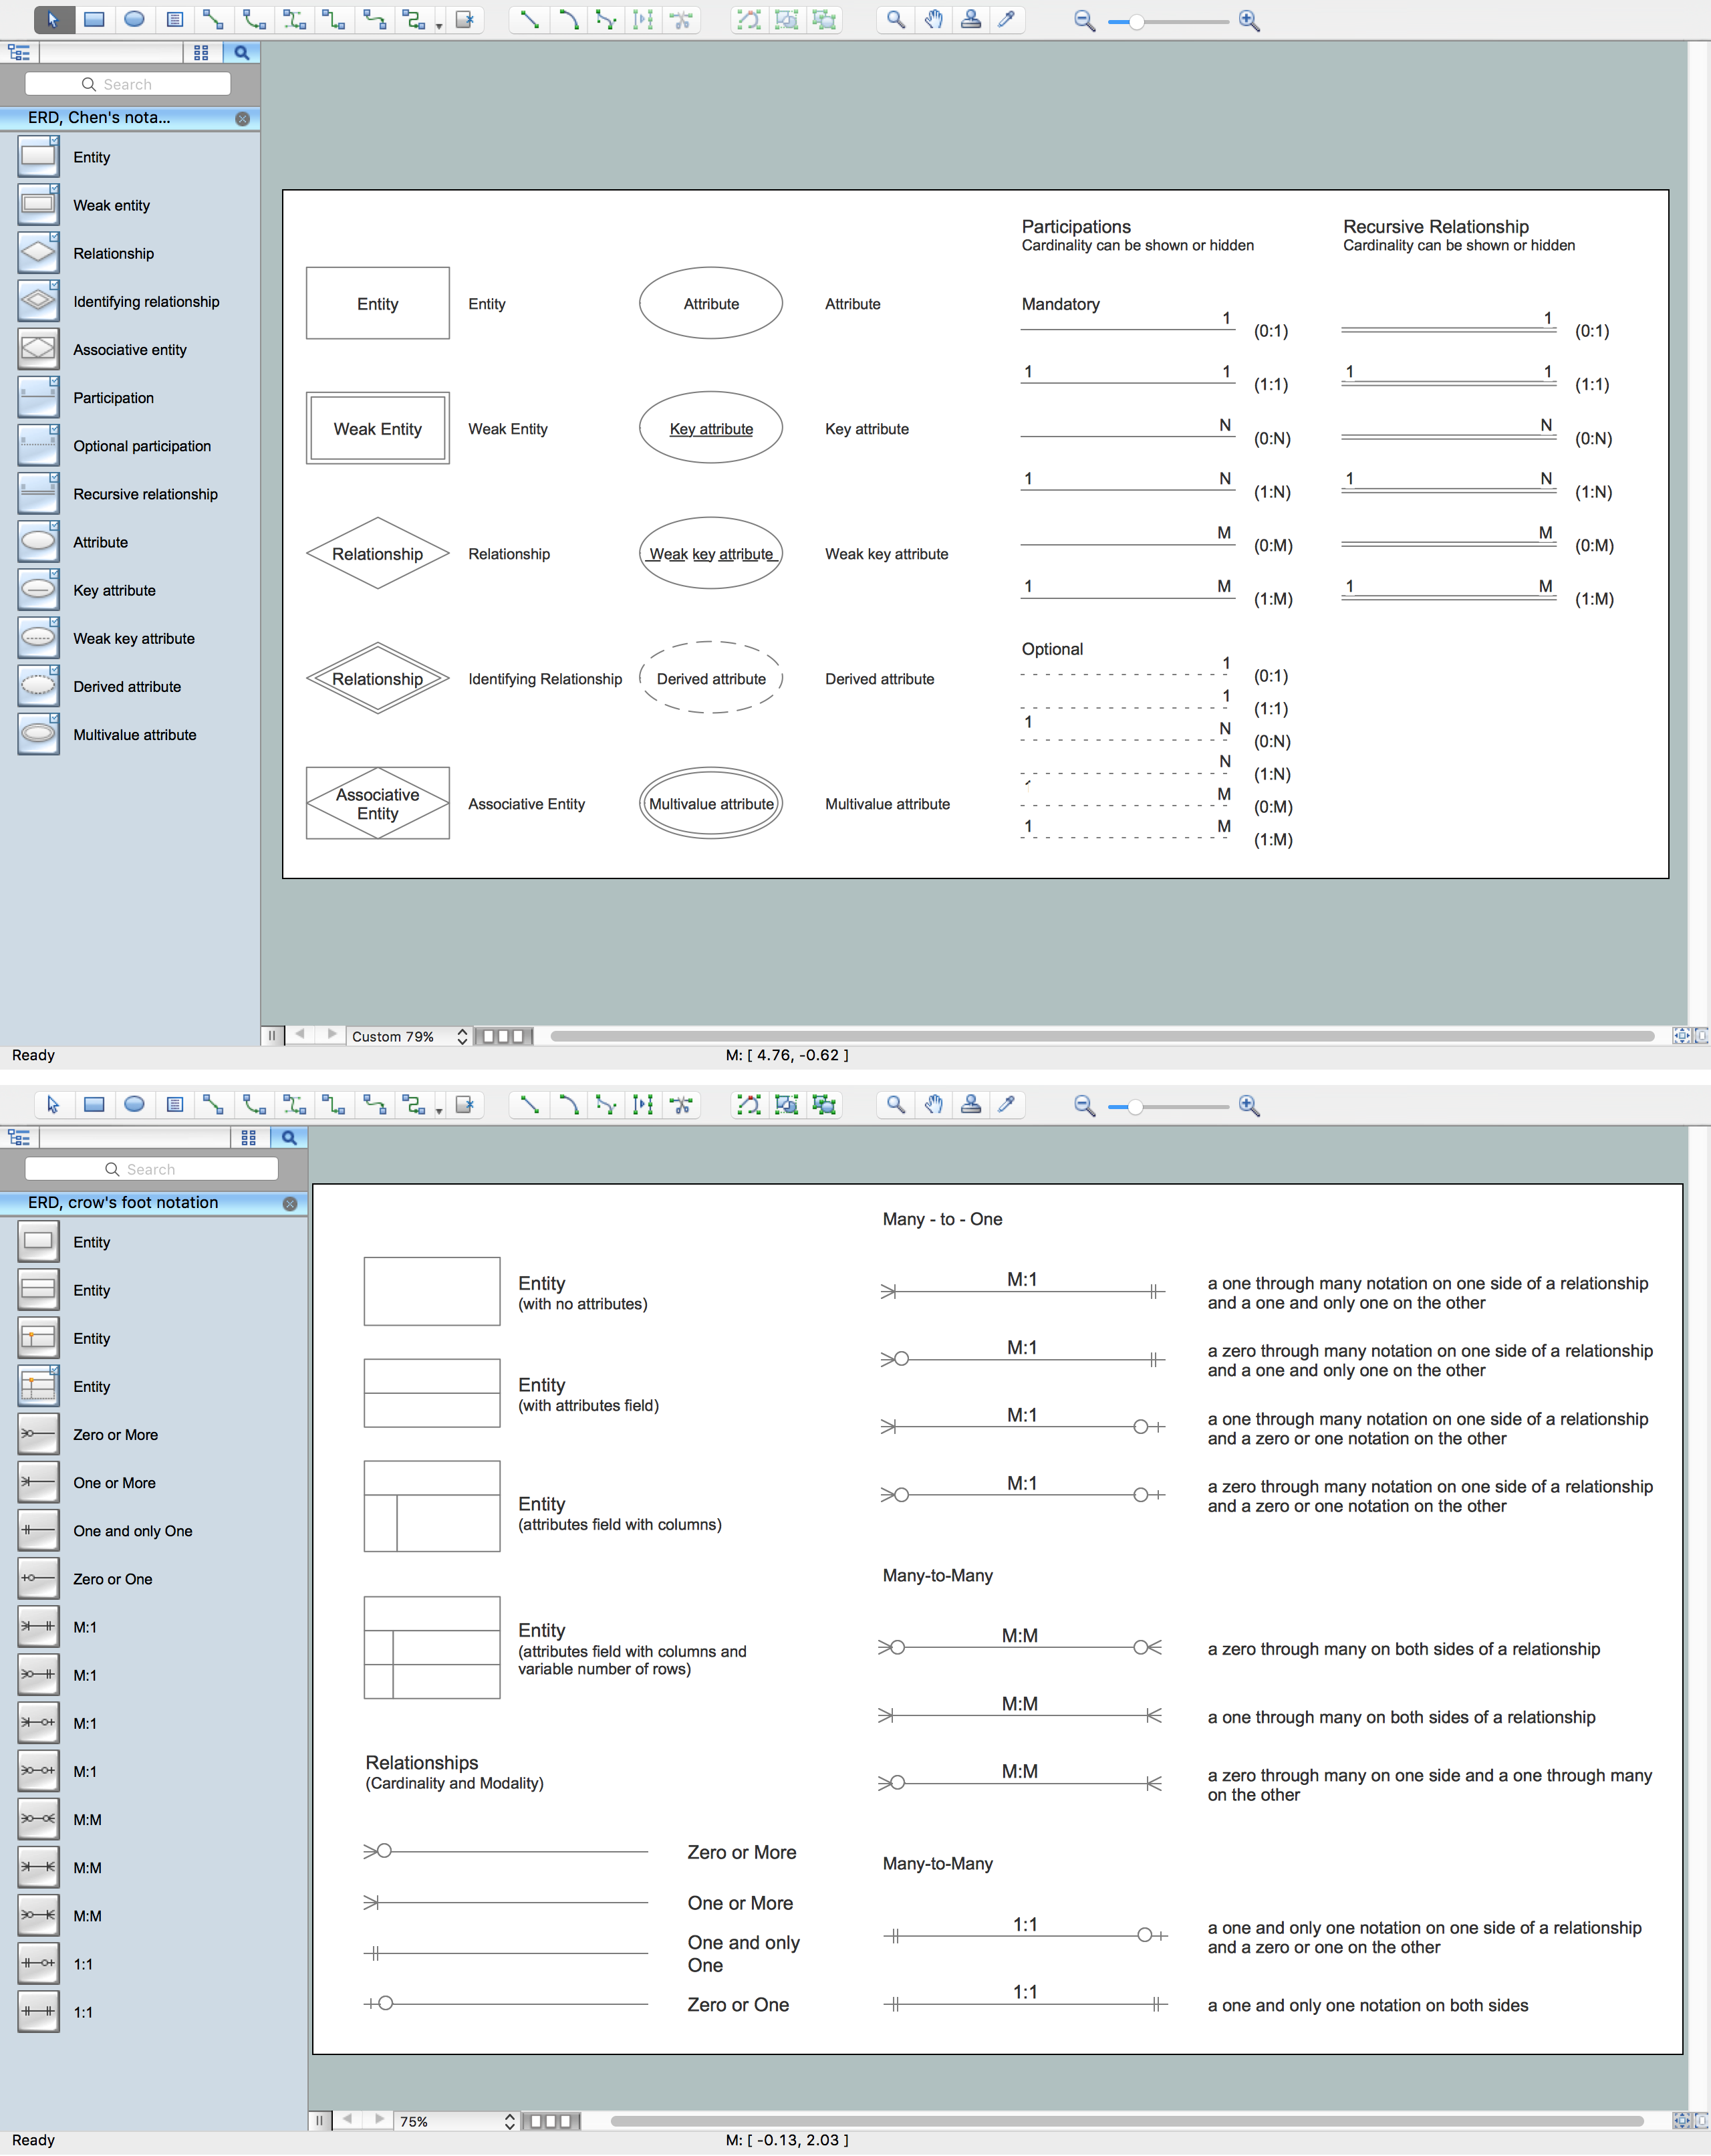
ERD Symbols and Meanings
Modeling your data using entity-relationship diagram (ERD) with Crow's Foot notation which is popular in Structured Systems Analysis, Barker's Notations, Design Methods and information engineering you need the software that is easy in use having all necessary elements for creating the needed flowcharts as well as their examples. You can find all essential ERD symbols and its meanings on our site with tutorials of how to use it and you can always use the already existing layouts for making your own diagrams in our Solution Park. Once you download our application with extension of hundreds of design elements you’ll find it simple to start using it straight away and you’ll be pleasantly surprised of how smart this tool for making the charts is. Try it today for saving your time sake not to look for something else once you have great chance to use this excellent product already now!Components of ER Diagram. Professional ERD Drawing
In order to model some data, illustrate the logical structure and system design of databases, the Entity Relationship Diagram (ERD or ER Diagram as well as E-R Diagram) was introduced by Peter Chen as a modeling technique for software development. Using three main elements which are attributes, entities and relationships make possible to create so called ERD and to do it with help of ConceptDraw DIAGRAM software is simpler than ever now. As once you download ConceptDraw STORE, you will find the samples of ERDs which you can use for making your own diagram in short terms using all the elements necessary for this purpose. Immensely popular in software engineering this method for modeling database is common for IT engineers use as well as any other IT specialists once they want to succeed in their job. So why not to try our application just now to make sure you keep up with the times and use all necessary tools for achieving your goals?Entity Relationship Diagram. Professional ERD Drawing
Entity Relationship Diagram Software, Design Elements - Chen (Windows, Macintosh)Entity Relationship Diagram Symbols. Professional ERD Drawing
Very commonly used in the database structure design, the sematic modelling method is one the ways of describing data structures as well as its modelling, based on the meaning of this data. ER-model based diagrams (ERD) consist of these main components: relation, entity and attributes. To be able to create such diagram, you have to mention the entities with their names presented in a form of a rectangle and the relations in a way of non-directional line connecting two entities. To help you to create this chart, we developed ConceptDraw STORE product full of libraries with vector elements you can use for your flowchart. Also we provide you with Solutions section on this site where you can find the numerous stencil libraries, samples and examples to simplify your work with software called ConceptDraw DIAGRAM which is the only one offering that many symbols and templates for making professionally looking smart and mature diagrams.Entity Relationship Diagram Software. Professional ERD Drawing
Entity Relationship Diagram SoftwareData Modeling with Entity Relationship Diagram
Data Modeling with Entity Relationship DiagramDesign Element: Chen. Professional ERD Drawing
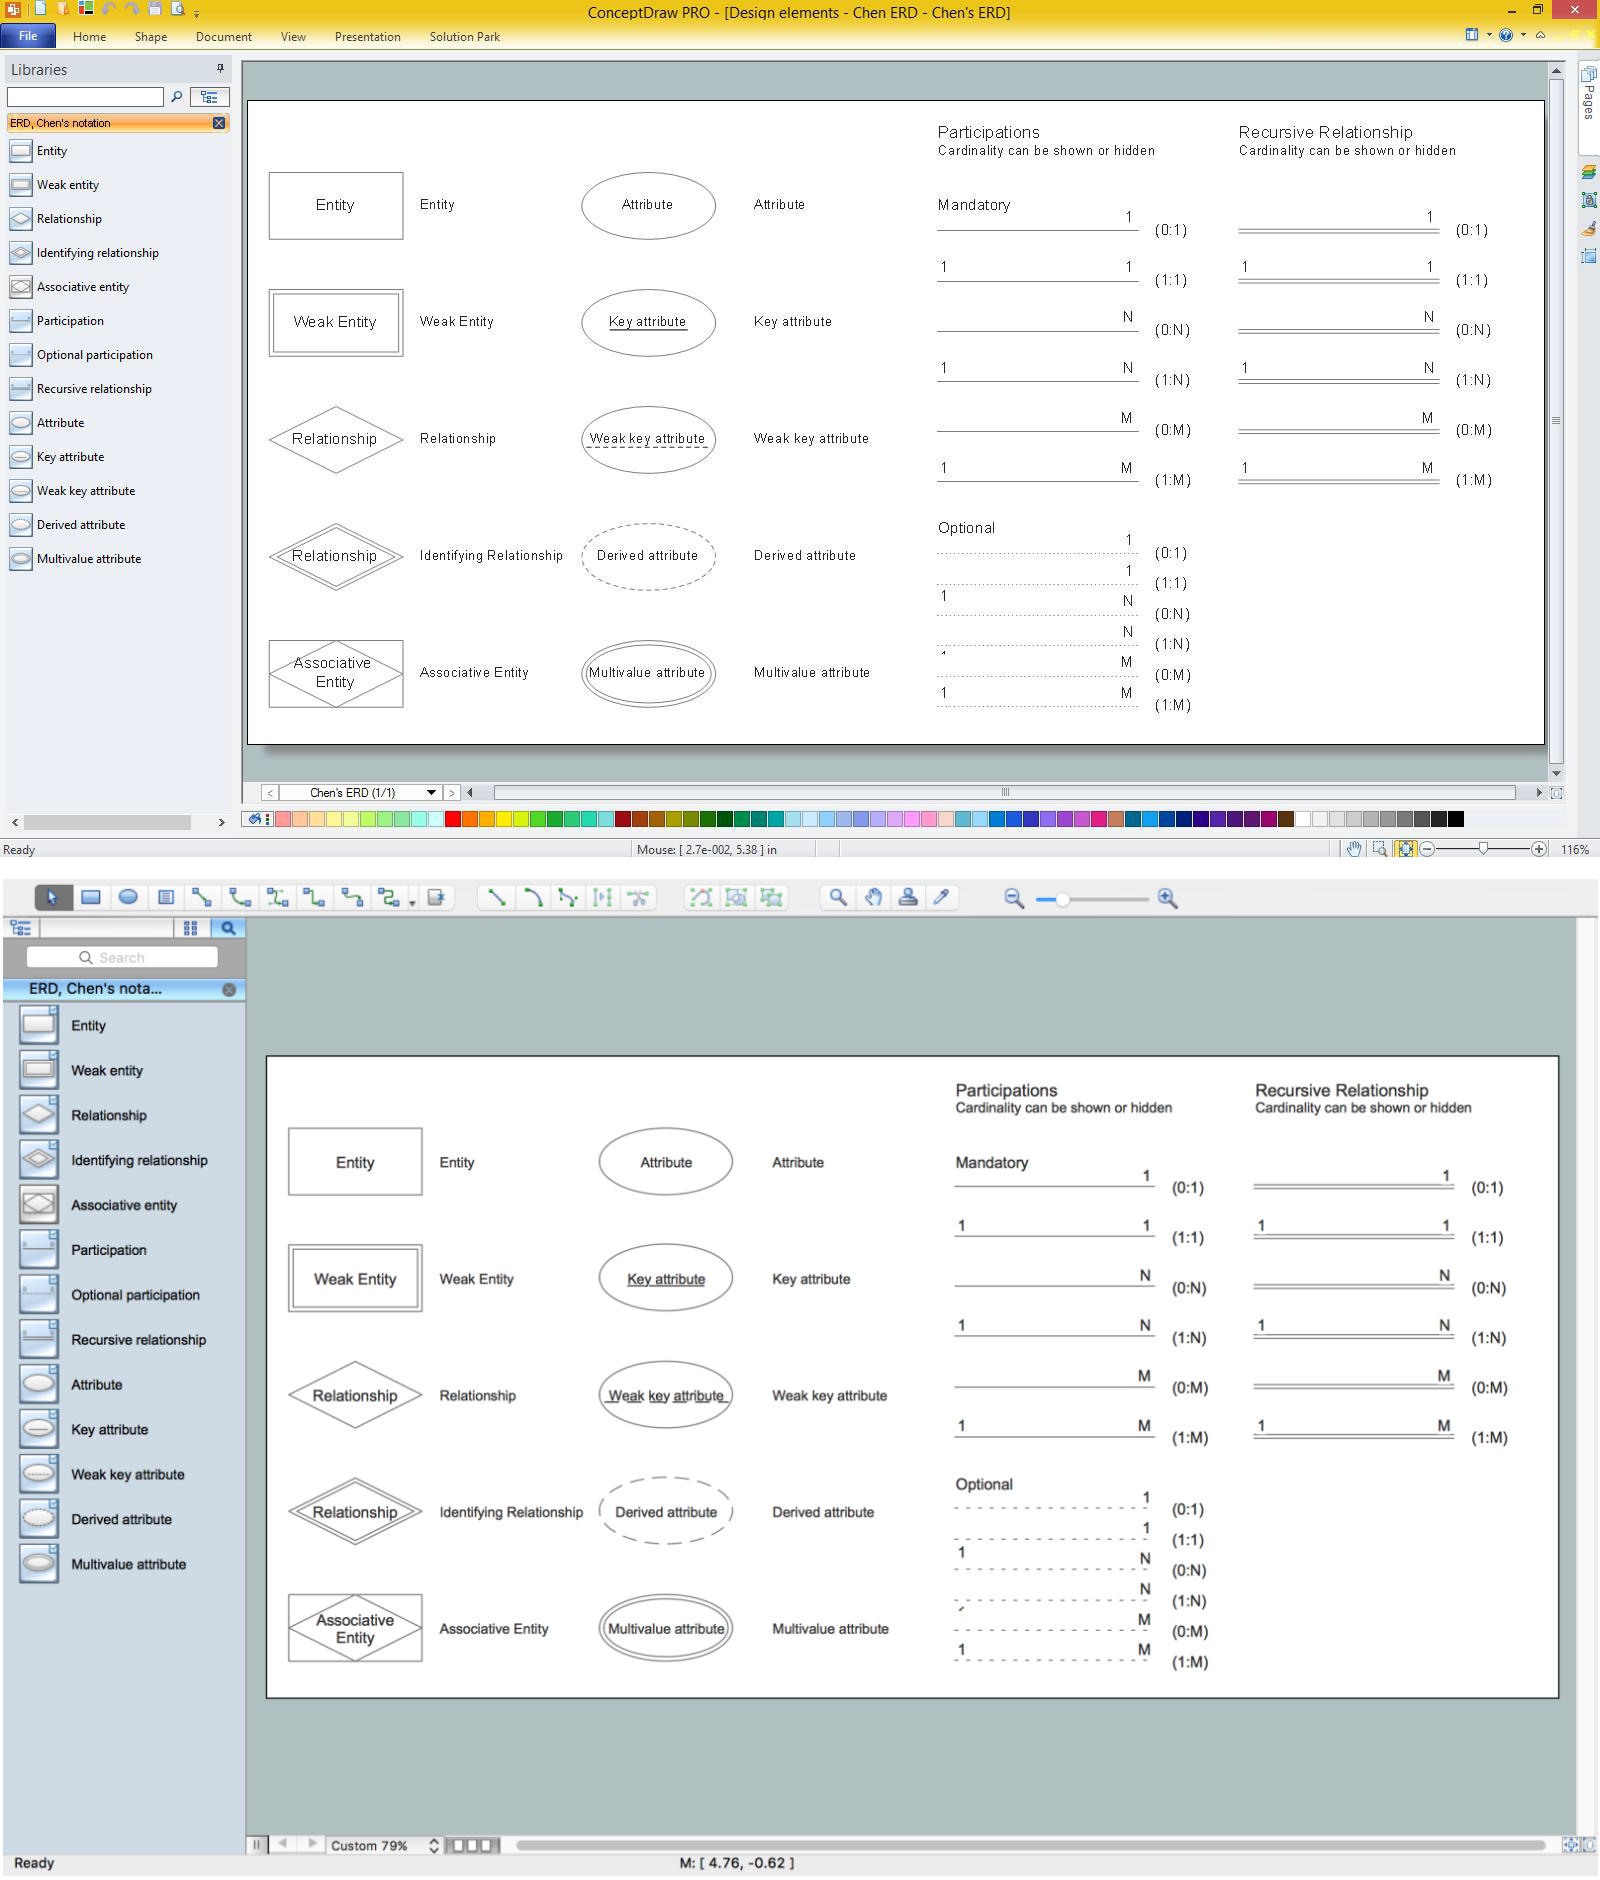
Entity-relationship diagrams or ERD are very well known for representing some data models as well as the relationships and the connections between them. Chen notation was first introduced by Chen and then developed by Barker and it provides lots of data modelling tool as, for example, decomposition charts or attribute diagrams as well as entity-relationship diagrams. The name of the diagram itself explains the reason of creating such type of diagram as it shows the relationship between the different entities which are the real or sometimes abstract objects, such as ideas, people, events, items, conditions, etc. Having ConceptDraw DIAGRAM on your desktop means having lots of design elements for creating any flowchart, charts, diagrams, schemes or plans with help of lots of templates as well as different examples of already existing diagrams, including the ERD. Downloading this application means helping yourself in drawing anything you need in a very short term and having the final result looking very professional.Design Element: Crows Foot. Professional ERD Drawing
It may sound very complex, but for those who work with it, especially in IT business, entity-relationship diagram is a very usual thing that can be used for executing the specification of some data warehouse for any designed system and for documenting all of the entities in system as well as their interactions with each other including the important domain objects or entities identification and the properties of these objects which are called the attributes. Also you can make ERD for visualizing relationships of these attributes to some other objects no matter what these objects are. To sum up, ER Diagrams of Crow’s Foot as well as Chen notations can help you to make the chart which consists of elements that are meant to describe each of the system’s element and to make such diagram is better in ConceptDraw DIAGRAM as it is the only one that professional software.Entity Relationship Software. Professional ERD Drawing
Entity Relationship Diagram is a data modelling tool which can be helpful in organizing any project's data into the entities as well as in defining the relationships between all of these entities. ERD can be created in many different kinds of existing applications, but the best one seems to be ConceptDraw DIAGRAM as it is the one offering the most sophisticated service and very convenient tools for drawing any kinds of charts, flowcharts, diagrams, schemes, plans and it can be so very useful in making all of them so quick as there are very many tools, such as stencil libraries and many already existing samples and templates for it. Our ConceptDraw DIAGRAM solution supports Chen's and Crow’s Foot notations that are often being used for describing database structures. But no matter which notation you want to use, do it with help of ConceptDraw DIAGRAM software as it’s possible to finish your work in a very short time finding the process of creating it very entertaining and simple as well as fast.Entity Relationship Diagram Software Engineering. Professional
In order to model some data, illustrate the logical structure and system design of databases, the Entity Relationship Diagram (ERD or ER Diagram as well as E-R Diagram) was introduced by Peter Chen as a modeling technique for software development. Using three main elements which are attributes, entities and relationships make possible to create so called ERD and to do it with help of ConceptDraw DIAGRAM software is simpler than ever now. As once you download ConceptDraw STORE, you will find the samples of ERDs which you can use for making your own diagram in short terms using all the elements necessary for this purpose. Immensely popular in software engineering this method for modeling database is common for IT engineers use as well as any other IT specialists once they want to succeed in their job. So why not to try our application just now to make sure you keep up with the times and use all necessary tools for achieving your goals?
 Entity Relationship Diagram ( ERD ) Solution. ConceptDraw.com
This diagram was created in ConceptDraw DIAGRAM using the ERD , Chen's
Notation Library from the Entity-Relationship Diagram ( ERD ) Solution.
Entity Relationship Diagram. Professional ERD Drawing
Working as a software engineer making an abstract data model it is convenient to create them in ConceptDraw DIAGRAM application provided with a huge choice of examples of different diagram to simplify your work and to save your precious time. Using the Entity-Relationship Diagram (ERD) solution making the ER Diagrams created with Crow’s Foot notation can present you as a professional designer even if you are not that experienced yet. To illustrate the databases’ logical structure is obviously better with help of these diagrams that can be made in a short term looking really sophisticated. The most common shapes for Crow’s Foot notation are bars, circles and symbols which indicate various possibilities whether it’s many-to-one or many-to-many relationships. As a result, you can review, modify or convert the final diagram into many different formats such as PDF file, MS Visio, MS PowerPoint and many other graphic ones using ConceptDraw STORE which you can find here on our site. So the earlier you download the software with extension and start to use it the sooner you will succeed with your work!- How To Make Chen ER Diagram - ERD | What Is Chen Notation
- ERD (crow's foot notation )
- ERD Symbols and Meanings | Design Element: Crows Foot for Entity ...
- Entity Relationship Diagram Symbols | Notation & Symbols for ERD
- Entity Relationship Diagram Symbols | ERD Symbols and Meanings ...
- UML Class Diagram Notation | ERD Symbols and Meanings | UML ...
- ERD Symbols and Meanings | Entity Relationship Diagram Symbols ...
- ERD Symbols and Meanings | Entity Relationship Diagram Symbols ...
- Cara Membuat Erd Notations Crowfoot
- Erd Notations
- ERD Symbols and Meanings | Crow Foot Notation Microsoft Word
- Entity Relationship Diagram Symbols | Notation & Symbols for ERD
- ERD Symbols and Meanings | ER Diagram Styles | Er Notation
- ERD Symbols and Meanings | What is Entity-Relationship Diagram ...
- Extends Notation In Er Diagram
- ERD Symbols and Meanings | Notation & Symbols for ERD
- Entity Relationship Diagram Symbols - ERD (crow's foot notation )
- ERD , crow's foot notation - Vector stencils library | ERD , Chen's ...
- Entity Relationship Diagram Symbols | Chen ERD Diagram | ERD ...
- Entity Relationship Diagram Symbols - ERD (crow's foot notation )


_Win_Mac.png)


_Win_Mac.png)
