This site uses cookies. By continuing to browse the ConceptDraw site you are agreeing to our Use of Site Cookies.

ERD Symbols and Meanings

Crow's foot notation is used in Barker's Notation, Structured Systems Analysis and Design Method (SSADM) and information engineering. Crow's foot diagrams represent entities as boxes, and relationships as lines between the boxes. Different shapes at the ends of these lines represent the cardinality of the relationship.
The Chen's ERD notation is still used and is considered to present a more detailed way of representing entities and relationships.
To create an ERD, software engineers mainly turn to dedicated drawing software, which contain the full notation resources for their specific database design - ERD symbols and meanings. CS Odessa has released an all-inclusive Entity-Relationship Diagram (ERD) solution for their powerful drawing program, ConceptDraw DIAGRAM.
How to Build an Entity Relationship Diagram (ERD)
HelpDesk

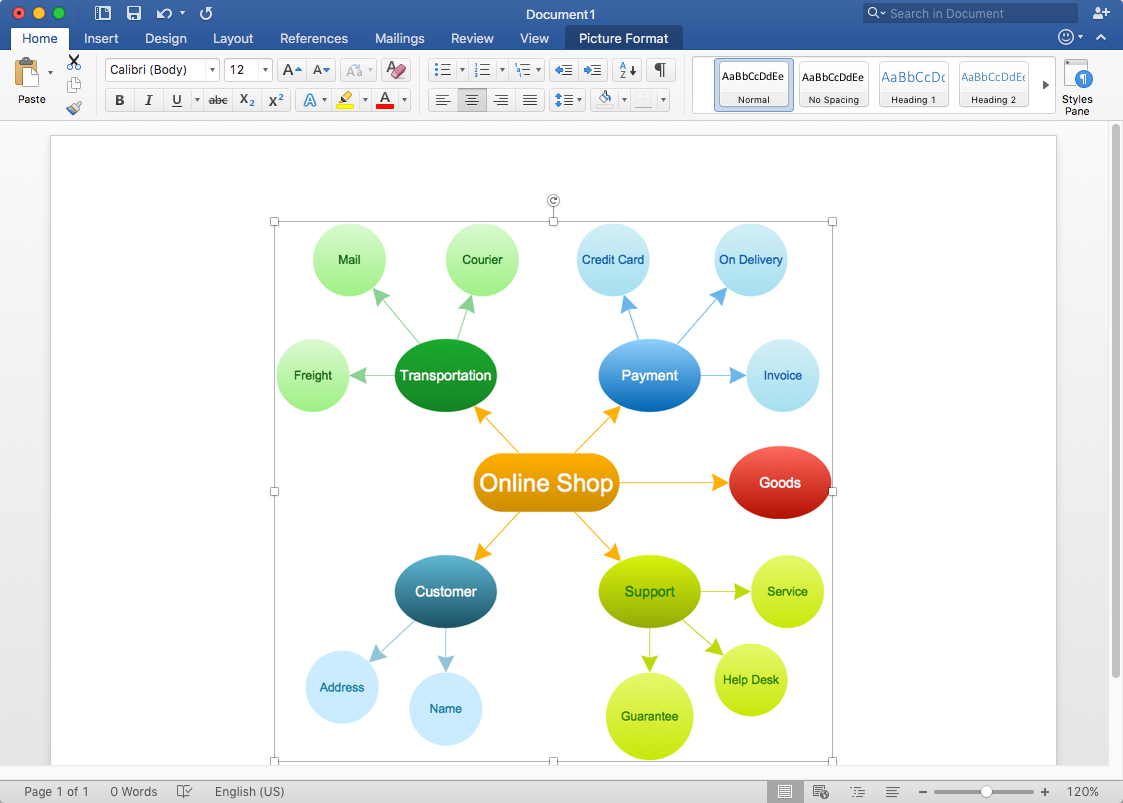
How to Add a Concept Map to MS Word Document

ConceptDraw DIAGRAM allows you to easily create concept maps and then insert them into an MS Word document.
HelpDesk

How to Add a Bubble Diagram to MS Word

A bubble diagram is used the same purpose as a scatter diagram, but in the case, if the data has three dimensions, each of that containing the set of values. A bubble chart is a diagram in which the data points are replaced with bubbles, and the size of the bubbles represents some additional dimension of the data. A bubble chart does not have the axis. The sizes of the bubbles are determined by the values in the third dimension. Any additional information about the entities beyond their three primary dimensions can be depicted by rendering bubbles in colors and patterns that are selected in a certain way. The legend containing the further information can be added to a bubble diagram. ConceptDraw DIAGRAM allows you to easily create various business management and marketing charts, including bubble diagrams and then add them to an MS Word document.

ERD, entity-relationship diagram, ER-diagram, Crow’s Foot Notation Crow's Foot Notation

ERD, entity-relationship diagram, ER-diagram, Crow’s Foot Notation
Crow’s Foot Notation solution extends ConceptDraw DIAGRAM software with powerful drawing tools, samples and library of predesigned vector Crow's Foot notation icons to help you easy describe the databases using the Entity-Relationship models and design professional-looking ER diagrams based on the popular Crow's Foot notation.

Entity Relationship Diagram Symbols

Creating an entity-relationship (ER) model is to visually represent the structure of a business database, where data equates to entities (or objects) that are linked by defined relationships expressing dependencies and requirements. By nature it is an abstract visualization, the first step in the design process towards creating a logical and functional database.
ERD symbols used for professional ERD drawing are collected in libraries from the Entity-Relationship Diagram (ERD) solution for ConceptDraw DIAGRAM.

Entity Relationship Diagram - ERD - Software for Design Crows Foot ER Diagrams

Crow's Foot notation was proposed by Gordon Everest. According to this notation, the entity is represented by rectangle, relation is depicted by line which ties two entities involved in a relationship. Entity-relationship diagrams based on both Chen's and Crow's Foot notations, can be easily drawn using the ConceptDraw DIAGRAM ERD diagrams software tools for design element Crow's Foot and Chen from Entity-Relationship Diagram (ERD) solution.
How to Build an Entity Relationship Diagram (ERD)

Entity Relationship Diagram Examples

Creating an entity-relationship (ER) model is to visually represent the structure of a business database, where data equates to entities (or objects) that are linked by defined relationships expressing dependencies and requirements. By nature it is an abstract visualization, the first step in the design process towards creating a logical and functional database.
ConceptDraw gives the ability to describe a database using the Entity-Relationship model. Entity-Relationship Diagram solution includes icons advocated by Chen's and Crow’s Foot notation that can be used when describing a database.
How to Build an Entity Relationship Diagram (ERD)

mind map, mindmapping tools, mindmap, create book, create MS Word document, solution park Word Exchange

mind map, mindmapping tools, mindmap, create book, create MS Word document, solution park
This solution extends ConceptDraw MINDMAP software with the ability to quickly create the framework for a future article or book, fill the structure with ideas, and use it to produce an MS Word document with just a simple click of the mouse.

IDEF0 method, IDEF0 notation IDEF0 Diagrams

IDEF0 method, IDEF0 notation
IDEF0 Diagrams visualize system models using the Integration Definition for Function Modeling (IDEF) methodology. Use them for analysis, development and integration of information and software systems, and business process modelling.