UML Sequence Diagram Example. SVG Vectored UML Diagrams Tools
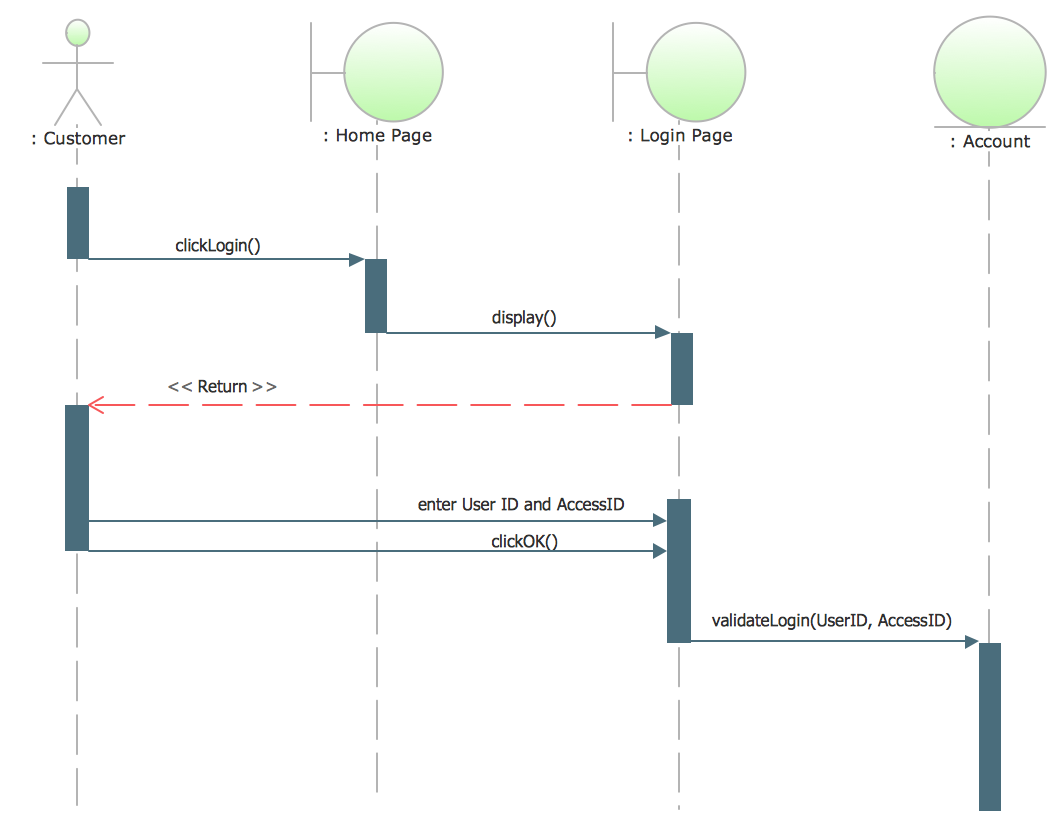
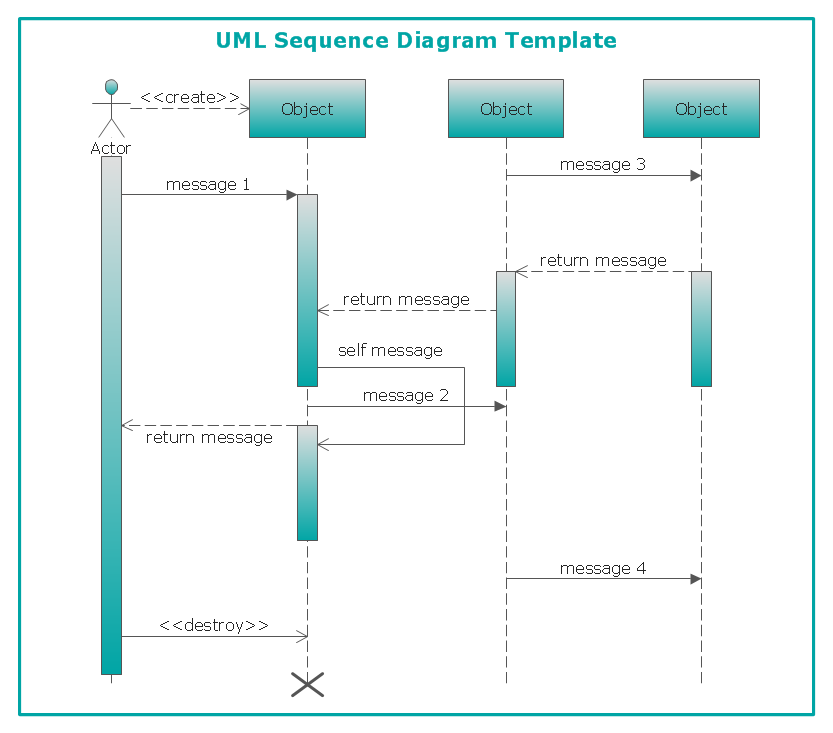
UML Sequence Diagram

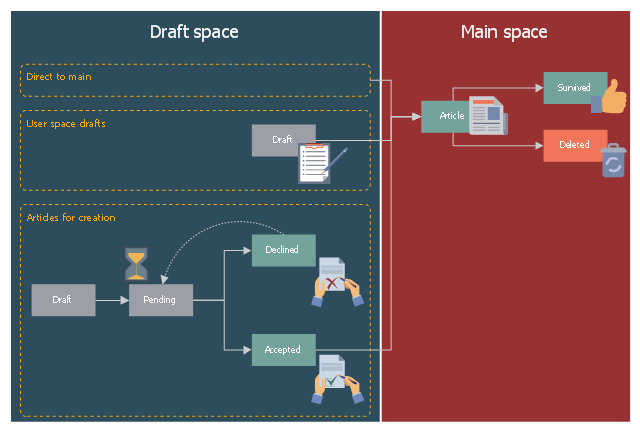
This workflow diagram example was designed on the base of Wikimedia Commons file: Article creation workflows (enwiki).svg.
"Article creation process workflows for English Wikipedia are presented as a directed graph and split into "draft space" and "main space"." [commons.wikimedia.org/ wiki/ File:Article_ creation_ workflows_ %28enwiki%29.svg]
This file is licensed under the Creative Commons Attribution-Share Alike 4.0 International license. [creativecommons.org/ licenses/ by-sa/ 4.0/ deed.en]
"An encyclopedia or encyclopaedia (also spelled encyclopædia, see spelling differences) is a type of reference work or compendium holding a comprehensive summary of information from either all branches of knowledge or a particular branch of knowledge. Encyclopedias are divided into articles or entries, which are usually accessed alphabetically by article name. Encyclopedia entries are longer and more detailed than those in most dictionaries. Generally speaking, unlike dictionary entries, which focus on linguistic information about words, encyclopedia articles focus on factual information concerning the subject for which the article is named." [Encyclopedia. Wikipedia]
The workflow diagram example "Article creation process workflows" was created using ConceptDraw PRO software extended with the Business Process Workflow Diagrams solution from the Business Processes area of ConceptDraw Solution Park.
Workflow diagram
Pyramid Diagram

SSADM Diagram

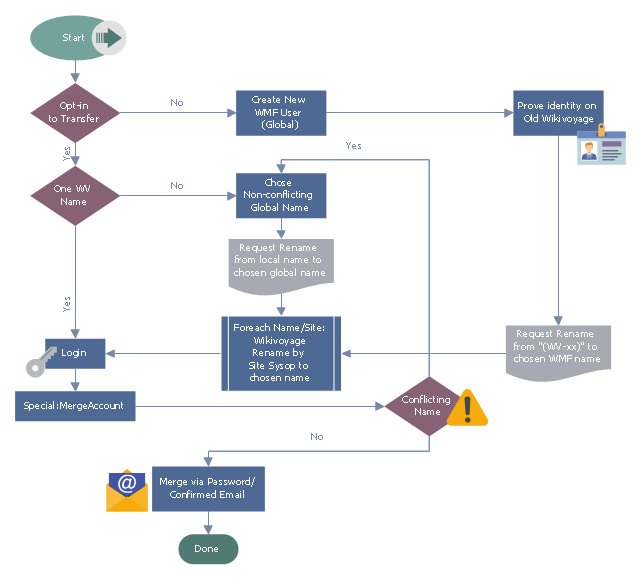
This flowchart example was designed on the base of the Wikimedia Commons file: Wikivoyage Global ID Workflow.svg.
"Workflow for getting a global username for Wikivoyage users migrating to WMF." [commons.wikimedia.org/ wiki/ File:Wikivoyage_ Global_ ID_ Workflow.svg]
This file is licensed under the Creative Commons Attribution-Share Alike 3.0 Unported license. [creativecommons.org/ licenses/ by-sa/ 3.0/ deed.en]
"Your global account (also called unified login or SUL/ single user login) is your single username reserved across all Wikimedia projects (except some special wikis). This gives you a consistent identity throughout Wikimedia, enables features like global user pages, reduces vectors for impersonation, and lets you visit many projects without manually logging in on each wiki." [meta.wikimedia.org/ wiki/ Help:Unified_ login]
The flowchart example "Wikivoyage Global ID Workflow" was created using ConceptDraw PRO software extended with the Business Process Workflow Diagrams solution from the Business Processes area of ConceptDraw Solution Park.
Business process flowchart
Scrum process work items and workflow

Pyramid Diagram

Pyramid Diagram

How to draw Metro Map style infographics? Moscow, New York, Los Angeles, London

Program Structure Diagram

UML Business Process

Flowchart Software


Venn Diagram Examples for Problem Solving. Venn Diagram as a Truth Table

- Article creation process workflows | Pencil Svg
- Flow chart Example. Warehouse Flowchart | Best Program to Make ...
- Process Flowchart | UML Sequence Diagram Example. SVG ...
- UML Diagram | Pyramid Diagram | Wikivoyage Global ID Workflow ...
- Pyramid Diagram | Purchase funnel diagram | Workflow to Make a ...
- Pyramid Chart Examples | Wikivoyage Global ID Workflow | Data ...
- Article creation process workflows | Event-driven Process Chain ...
- UML Use Case Diagram Example Registration System | UML ...
- UML Sequence Diagram | Basic Flowchart Symbols and Meaning ...
- Atmosphere air composition | Workflow diagram - Weather forecast ...
- Diagramming Software for Design UML Collaboration Diagrams ...
- Work Flow Process Chart | Flow chart Example. Warehouse ...
- Workflow Diagram Start Stop
- Workflow - Lead to Opportunity | Lead to opportunity sales flow ...
- Design elements - Time | Design elements - Workflow management ...
- Entity Relationship Diagram Examples | Local area network (LAN ...
- Business Process Workflow Diagrams
- Business Process Diagrams | Process Flowchart | Business Process ...
- Pyramid Diagram | Software Work Flow Process in Project ...
- Cloud applications | Cloud Computing diagram | Mobile cloud ...