Product Overview
Gantt charts for planning and scheduling projects

How to Discover Critical Path on a Gantt Chart

PERT Chart Software

Product Overview

How to Report Task's Execution with Gantt Chart

 Project Exchange
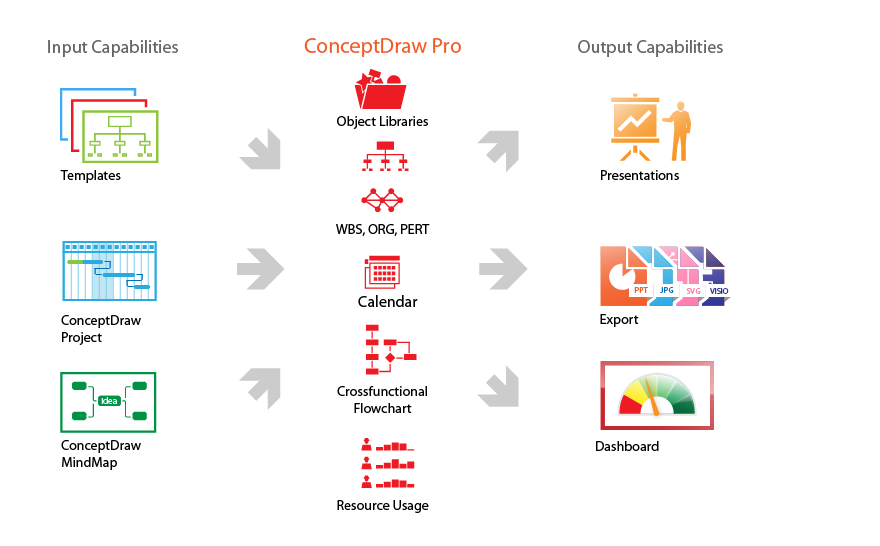
This solution extends ConceptDraw PROJECT and ConceptDraw MINDMAP software with the ability to import and export project data.
Gantt Chart Software

Gantt chart examples

Local area network (LAN). Computer and Network Examples
 diagram")

ConceptDraw DIAGRAM Network Diagram Tool


"Project planning is part of project management, which relates to the use of schedules such as Gantt charts to plan and subsequently report progress within the project environment.
Initially, the project scope is defined and the appropriate methods for completing the project are determined. Following this step, the durations for the various tasks necessary to complete the work are listed and grouped into a work breakdown structure. Project planning is often used to organize different areas of a project, including project plans, work loads and the management of teams and individuals. The logical dependencies between tasks are defined using an activity network diagram that enables identification of the critical path. Float or slack time in the schedule can be calculated using project management software. Then the necessary resources can be estimated and costs for each activity can be allocated to each resource, giving the total project cost. At this stage, the project schedule may be optimized to achieve the appropriate balance between resource usage and project duration to comply with the project objectives. Once established and agreed, the project schedule becomes what is known as the baseline schedule. Progress will be measured against the baseline schedule throughout the life of the project. Analyzing progress compared to the baseline schedule is known as earned value management.
The inputs of the project planning phase include the project charter and the concept proposal. The outputs of the project planning phase include the project requirements, the project schedule, and the project management plan." [Project planning. Wikipedia]
The flow chart example "Project planning process" was created using the ConceptDraw PRO diagramming and vector drawing software extended with the Flowcharts solution from the area "What is a Diagram" of ConceptDraw Solution Park.
Flowchart - Project planning process

Star Network Topology

Software Work Flow Process in Project Management with Diagram

This sample shows the Workflow Diagram that clearly illustrates stages a BPM consists of and relations between all parts of business. The Workflow Diagrams are used to represent the transferring of data during the work process, to study and analysis the working processes, and to optimize a workflow.
 PM Response
The PM Response solution extends the functional abilities in project management for all three ConceptDraw products by helping to improve the response time to project changes, to plan on how to effectively respond on issues and events impacting the project. It supplies the project managers, team leaders, and all other project participants with wide abilities of iteration planning, creative collaboration, effective decision-making, discussions of the project layout approaches and solving the project challenges, lets them use mind mapping technique for iteration planning and applying the project changes, to represent the projects data as Mind Maps and use them to construct the clear plans, to convert project maps to project implementations, to use different kinds of Visual diagrams to solve the current project problems and to make correct decisions, to plan resources usage and to respond to changes in the project environment.
- WBS Diagram | How to Report Task's Execution with Gantt Chart ...
- Work Breakdown Structure Example For Banking System
- UML Use Case Diagram Example Social Networking Sites Project ...
- Work Breakdown Structure For A Park
- Activity Network Diagram Method | Program Evaluation and Review ...
- System Breakdown Structure For Product Design Projects
- Work Breakdown Structure For Banking System
- PERT Chart Software | Activity Network (PERT) Chart | PM Easy ...
- Example Of Wbs Diagram Project Management
- Wbs Example For Epc Projects
- Project Management Structure Diagram
- Activity Network Diagram Method | Product Proposal Documents ...
- Sample Gant Chart For Networking Project Proposals
- PERT Chart Software | ConceptDraw PROJECT Project ...
- UML Use Case Diagram Example Social Networking Sites Project ...
- Project plan timeline - Request for proposal (RFP) | Activity Network ...
- Metropolitan area networks (MAN). Computer and Network ...
- Gantt Chart For Project Proposal
- Project planning process - Flowchart | CORRECTIVE ACTIONS ...
- In A Diagram Large And Medium Organizational Structure