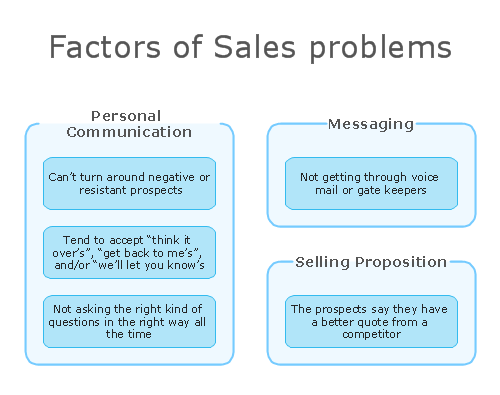
This site uses cookies. By continuing to browse the ConceptDraw site you are agreeing to our Use of Site Cookies.

Affinity Diagram

The affinity diagram is a business tool used to organize ideas and data. It is one of the Seven Management and Planning Tools. But how design the Affinity Diagram quick and easy? ConceptDraw DIAGRAM diagramming and vector drawing software offers the Seven Management and Planning Tools Solution from the Management Area.

Affinity Diagram

The Affinity Diagram shows the structure of large, complex factors that have an influence on a problem, and then divides them up into a smaller and simpler structure. The Affinity Diagram does not show a causal relationship between the factors.
This diagram is designed to prepare the data for further analysis of the cause-effect relationships. A typical size for an Affinity Diagram is approximately 40-50 topics in a chart.

Total Quality Management

ConceptDraw DIAGRAM diagramming and vector drawing software extended with Total Quality Management (TQM) Diagrams solution from the Quality area of ConceptDraw Solution Park is effective software for Total Quality Management.

CORRECTIVE ACTIONS PLANNING. Risk Diagram (PDPC)

Risk Diagram (PDPC) - ConceptDraw OFFICE suite is a software for Risks Diagram making. This diagram identifies possible risks in accomplishing corrective actions. With the Risks Diagram, one analyzes each action separately in a tree of all actions and develops a preventive action in response of each potential obstacles or circumstances which may be a risk.
7MP Tools
7MP Tools

Activity Network (PERT) Chart

Activity Network and Project Evaluation and Review Technique, or PERT, charts are a way of documenting and analyzing the tasks in a project.
This diagram is constructed as part of the process in creating a schedule of corrective actions. The Activity Network Chart (PERT) shows the logical connections and consequence of tasks to be performed. It displays the time period for problem solving and the implementation of all activities through the critical path.

seven management and planning tools Seven Management and Planning Tools

seven management and planning tools
Seven Management and Planning Tools solution extends ConceptDraw DIAGRAM and ConceptDraw MINDMAP with features, templates, samples and libraries of vector stencils for drawing management mind maps and diagrams.

Activity on Node Network Diagramming Tool

Activity on Node Network Diagramming Tool - Activity Network and Project Evaluation and Review Technique, or PERT, charts are a way of documenting and analyzing the tasks in a project.
This sample shows the Activity on node network diagramming method. It was created in ConceptDraw DIAGRAM diagramming and vector drawing software using the Seven Management and Planning Tools solution from the Management area of ConceptDraw Solution Park.

PERT Chart Software

PERT Chart Software - Activity Network and Project Evaluation and Review Technique, or PERT, charts are a way of documenting and analyzing the tasks in a project.
ConceptDraw DIAGRAM is a powerful diagramming and vector drawing software for designing professional looking PERT Charts quick and easy.

CORRECTIVE ACTIONS PLANNING. Involvement Matrix

The Involvement Matrix can identify the distribution of responsibilities and identify roles in a group or team. Use the Involvement Matrix to specify roles and responsibilities of actions in problem solving.
ConceptDraw Office suite is a software for corrective actions planning.
7MP Tools
7MP Tools

Workflow Diagram

Workflow diagram visually describes an repeatable pattern of organizational activity powered by resources. Workflow diagram explains and document the process flow which needs to be organized or exists and needs to be learned and executed. Workflow diagram can be part of project documentation, company policies or sertification process to comply a standard.

The workflow represents the transferring of data, documents or tasks during a work process. To make it easier to study and analyze working processes, and to present them in a simple visual manner, workflow diagrams are used. To create these diagrams professional use workflow diagram maker software ConceptDraw DIAGRAM.

Scientific Symbols Chart

ConceptDraw DIAGRAM is the beautiful design software that provides many vector stencils, examples and templates for drawing different types of illustrations and diagrams.


Mathematics Solution from the Science and Education area of ConceptDraw Solution Park includes a few shape libraries of plane, solid geometric figures, trigonometrical functions and greek letters to help you create different professional looking mathematic illustrations for science and education.

How To Create Onion Diagram

An onion diagram is a kind of chart that shows the dependencies among parts of an organization or process. The chart displays items in concentric circles, where the items in each ring depend on the items in the smaller rings. The Onion Diagram is able to show layers of a complete system in a few circles.
But how to create Onion Diagram? Now, it's very easy thanks to the ConceptDraw DIAGRAM diagramming and vector drawing software extended with Stakeholder Onion Diagrams Solution from the Management Area of ConceptDraw Solution Park.

Root Cause Analysis

The Seven Management and Planning Tools is a tool for Root Cause Analysis Tree Diagram drawing. This diagram is for Root Cause Analysis.
Analyze the root causes for factors that influenced the problem. This diagram is constructed separately for each highly prioritized factor. The goal of this is to find the root causes for the factor and list possible corrective action.