This site uses cookies. By continuing to browse the ConceptDraw site you are agreeing to our Use of Site Cookies.

Examples of Flowcharts, Org Charts and More

ConceptDraw examples covers a broad spectrum of business graphics categories. We separated all the graphic documents on application areas and had produced multiple solutions for each of them. ConceptDraw provides a wide variety of examples such as flowcharts, organizational charts, business charts, UML diagrams, database and ERD, directional map, network diagrams and lots more. Each solution accommodates 10+ examples that shows specific application cases of a diagram. ConceptDraw STORE is an application for downloading solutions with examples, templates and stencil libraries. Please choose any examples you are interested in, alternatively download them for free; you will need to install ConceptDraw to view them. As you will see, ConceptDraw is very powerful, you can use more than 10000 symbols, examples, and many pre-drawn templates, to create your own spectacular flowcharts, business diagrams, network diagrams and lots more, effortlessly, and in no time at all.
What is ConceptDraw OFFICE

TQM Diagram, TQM,  Quality Diagram, Business Workflow Diagram, Business, Workflow, Diagram, Total Quality Management Diagrams, Timelines, Presentations, Meeting Agendas, Problem to be solved, solution park Quality

TQM Diagram, TQM,  Quality Diagram, Business Workflow Diagram, Business, Workflow, Diagram, Total Quality Management Diagrams, Timelines, Presentations, Meeting Agendas, Problem to be solved, solution park
This solution extends ConceptDraw DIAGRAM and ConceptDraw MINDMAP with Quality Management Diagrams (Total Quality Management Diagrams, Timelines, Workflows, Value Stream Maps) and Mind Maps (Presentations, Meeting Agendas, Problem to be solved).

Affinity Diagram

The Affinity Diagram shows the structure of large, complex factors that have an influence on a problem, and then divides them up into a smaller and simpler structure. The Affinity Diagram does not show a causal relationship between the factors. This diagram is designed to prepare the data for further analysis of the cause-effect relationships.

Best Flowchart Software and Flowchart Symbols

For years ConceptDraw has been delivering high quality business process flow diagram solutions, turning ConceptDraw DIAGRAM into most comprehensive and powerful examples of best flowchart software available. It also known as professional flowchart maker of ConceptDRaw DIAGRAM. It include thousands of standard basic and creative flowchart symbols.

Flowchart Software

Flowchart is widely used in business, education and economic presentations to help the audience visualize the content better, or to find flaws in a process flow diagrams. Flowcharts are particularly useful for displaying how a process currently flow or could ideally function. Flowcharts can help you see whether the steps of a process are logical, uncover problems or miscommunications, define the boundaries of a process, and develop a common base of knowledge about a process.

ConceptDraw DIAGRAM flowchart software will help to quickly create new flowcharts, workflow, NS Diagram, BPMN Diagram, Cross-functional flowcharts, data flow diagrams and highlight flowcharts.

Feature-rich flowchart maker, free thousand flowchart examples and templates and colored symbols that will allow you to create professional looking flowcharts simply.

ConceptDraw DIAGRAM supports macOS and Windows.
How to Build a Flowchart

project,  project management, planning, project changes, solution park PM Response

project,  project management, planning, project changes, solution park
The PM Response solution extends the functional abilities in project management for all three ConceptDraw products by helping to improve the response time to project changes, to plan on how to effectively respond on issues and events impacting the project. It supplies the project managers, team leaders, and all other project participants with wide abilities of iteration planning, creative collaboration, effective decision-making, discussions of the project layout approaches and solving the project challenges, lets them use mind mapping technique for iteration planning and applying the project changes, to represent the projects data as Mind Maps and use them to construct the clear plans, to convert project maps to project implementations, to use different kinds of Visual diagrams to solve the current project problems and to make correct decisions, to plan resources usage and to respond to changes in the project environment.
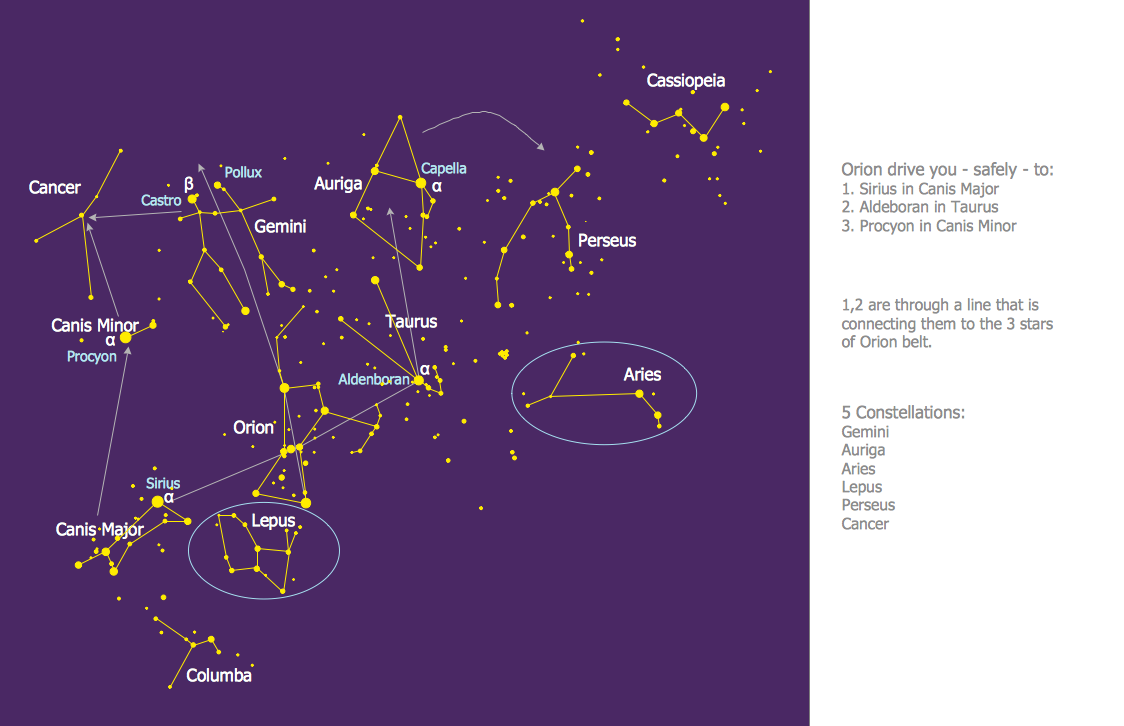
Constellation Chart

ConceptDraw DIAGRAM diagramming and vector drawing software provides the Astronomy solution from the Science and Education area. This solution offers you all needed tools for drawing the constellation chart of any complexity without difficulties.
Astronomy solution contains 4 libraries with vector objects of all variety of constellations: Constellations Except Zodiac Northern and Southern, Northern Constellations, Southern Constellations and Zodiac Constellations.

Flowchart Software

ConceptDraw DIAGRAM is a Mac OS X and Windows software. Numerous vector stencils, samples and templates created by designers are included in the basic package. This is classic flowchart maker which exactly follows the industry standards using flowchart symbols geathered during a ten years into solution park.

Use Case Diagrams technology with ConceptDraw DIAGRAM

Use case diagrams are used at the development of software and systems for definition of functional system requirements or system of systems. Use case diagram presents the consecution of object’s actions (user’s or system’s) which are executed for reaching the definite result.

Account Flowchart Stockbridge System. Flowchart Examples

Create your own flow charts of data processing systems using the ConceptDraw DIAGRAM diagramming and vector drawing software extended with the Cross-Functional Flowcharts solution from the Business Processes area of ConceptDraw Solution Park.
This is a flowchart of a data processing system combining manual and computerized processing to handle accounts receivable, billing, and general ledger.

Example of Flowchart Diagram

ConceptDraw - feature-rich flowchart software. This software includes flowchart diagram examples set. Libraries contain vector stencils that allow users to use RapidDraw technology. Users can start draw their own flowchart diagrams from existing examples by clicking on direction arrows.