 Timeline Diagrams
Timeline Diagrams solution extends ConceptDraw DIAGRAM diagramming software with samples, templates and libraries of specially developed smart vector design elements of timeline bars, time intervals, milestones, events, today marker, legend, and many other elements with custom properties, helpful for professional drawing clear and intuitive Timeline Diagrams. Use it to design simple Timeline Diagrams and designate only the main project stages, or highly detailed Timeline Diagrams depicting all project tasks, subtasks, milestones, deadlines, responsible persons and other description information, ideal for applying in presentations, reports, education materials, and other documentation.
Timeline Examples

How to Make a Timeline

Timeline Diagrams

Project Timeline

HelpDesk
How to Create a Timeline Diagram

The vector stencils library "Timelines and milestones" contains 24 shapes of time scales with start and finish dates, time interval bars with progress indication and brackets, milestone, event and today markers for drawing the timeline diagrams using the ConceptDraw PRO diagramming and vector drawing software.
"A timeline is a way of displaying a list of events in chronological order, sometimes described as a project artifact. It is typically a graphic design showing a long bar labelled with dates alongside itself and (usually) events labelled on points where they would have happened. ...
Another type of timeline is used for project management. In these cases, timelines are used to help team members to know what milestones need to be achieved and under what time schedule. For example, in the case of establishing a project timeline in the implementation phase of the life cycle of a computer system." [Timeline. Wikipedia]
The example "Design elements - Timelines solution" is included in the Timeline Diagrams solution from the Management area of ConceptDraw Solution Park.
Timeline and milestone symbols

Examples of Flowcharts, Org Charts and More


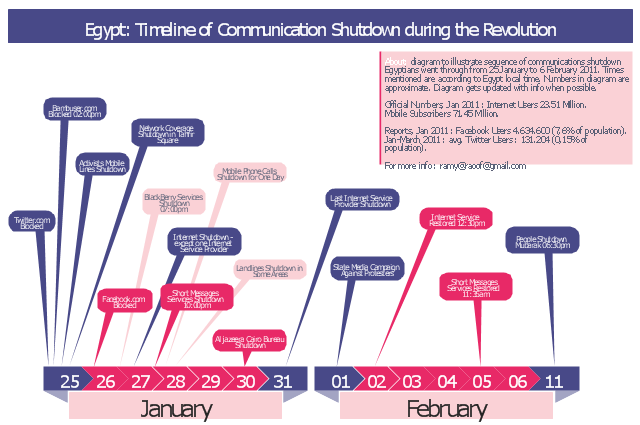
This typography infographics example was redesigned from the Wikimedia Commons file: Egypt timeline of communication shutdown during jan25revolution.jpg. [commons.wikimedia.org/ wiki/ File:Egypt_ timeline_ of_ communication_ shutdown_ during_ jan25revolution.jpg]
This file is licensed under the Creative Commons Attribution 3.0 Unported license. [creativecommons.org/ licenses/ by/ 3.0/ deed.en]
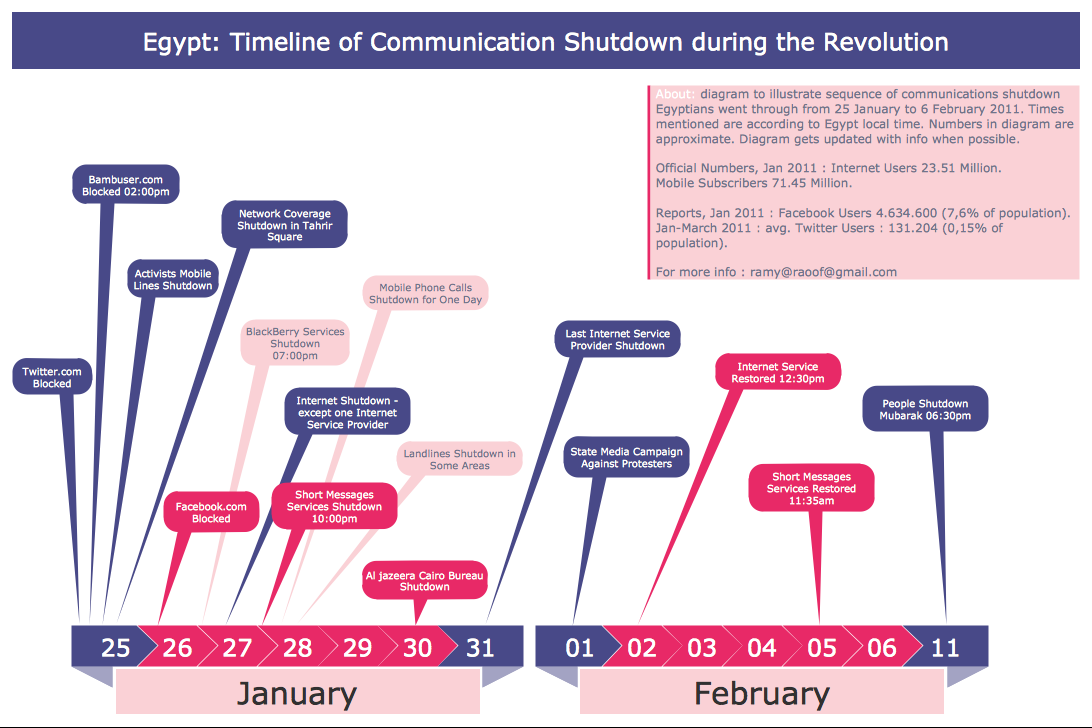
Diagram to illustrate sequence of communications shutdown Egyptians went through from 25 January to 06 February 2011. Times mentioned are according to Egypt local time. Numbers in the diagram are approximate. Last update of the diagram October 2011.
"2011 Internet shutdown.
Diagram to illustrate sequence of communications shutdown Egyptians went through from 25 January to 06 February 2011. Times mentioned are according to Egypt local time. Numbers in the diagram are approximate. Last update of the diagram October 2011.
The 2011 Egyptian protests began on 25 January 2011. As a result, on January 25 and 26, the government blocked Twitter in Egypt and later Facebook was blocked as well.
On January 27, various reports claimed that access to the Internet in the entire country had been shut down. ...
On February 2, connectivity was re-established by the four main Egyptian service providers. A week later, the heavy filtering that occurred at the height of the revolution had ended and bloggers and online activists who had been arrested were released." [Internet in Egypt. Wikipedia]
The example "Egypt timeline of communication shutdown during jan 25 revolution" was created using the ConceptDraw PRO diagramming and vector drawing software extended with the Typography Infographics solition from the area "What is infographics" in ConceptDraw Solution Park.
This file is licensed under the Creative Commons Attribution 3.0 Unported license. [creativecommons.org/ licenses/ by/ 3.0/ deed.en]
Diagram to illustrate sequence of communications shutdown Egyptians went through from 25 January to 06 February 2011. Times mentioned are according to Egypt local time. Numbers in the diagram are approximate. Last update of the diagram October 2011.
"2011 Internet shutdown.
Diagram to illustrate sequence of communications shutdown Egyptians went through from 25 January to 06 February 2011. Times mentioned are according to Egypt local time. Numbers in the diagram are approximate. Last update of the diagram October 2011.
The 2011 Egyptian protests began on 25 January 2011. As a result, on January 25 and 26, the government blocked Twitter in Egypt and later Facebook was blocked as well.
On January 27, various reports claimed that access to the Internet in the entire country had been shut down. ...
On February 2, connectivity was re-established by the four main Egyptian service providers. A week later, the heavy filtering that occurred at the height of the revolution had ended and bloggers and online activists who had been arrested were released." [Internet in Egypt. Wikipedia]
The example "Egypt timeline of communication shutdown during jan 25 revolution" was created using the ConceptDraw PRO diagramming and vector drawing software extended with the Typography Infographics solition from the area "What is infographics" in ConceptDraw Solution Park.
Infographics
"Value Stream Mapping (VSM):
– Special type of flow chart that uses symbols known as "the language of Lean" to depict and improve the flow of inventory information. ...
Value Stream Mapping ...
Provide optimum value to the customer through a complete value creation process with minimum waste in:
– Design (concept to customer);
– Design (concept to customer);
– Build (order to delivery);
– Sustain (in-use through life cycle to service)." [courses.washington.edu/ ie337/ Value_ Stream_ Mapping.pdf]
This sample Value Stream Map shows how customer value is created in the steps of manufacturing, production control, and shipping processes.
This VSM example was created using the ConceptDraw PRO diagramming and vector drawing software extended with the Value Stream Mapping solution from the Quality area of ConceptDraw Solution Park.
Value stream mapping

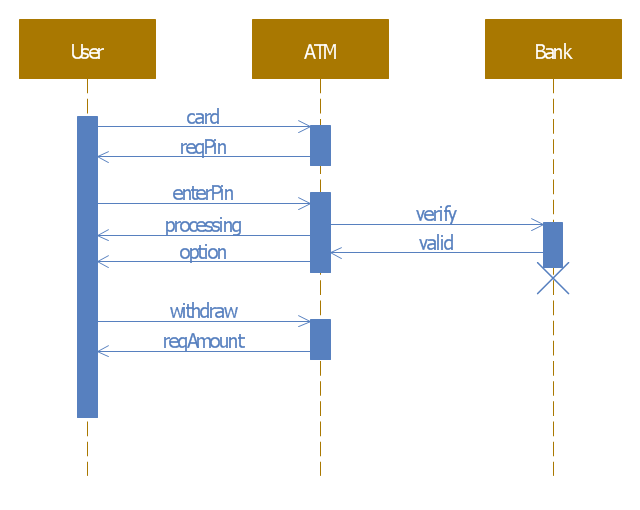
This example of automated teller machine (ATM) UML sequence diagram was created on the base of figure 5 "Sequence diagram" on the webpage "Message Sequence Charts and their Ilk" from the website of the University of California Irvine (UCI) Donald Bren School of Information and Computer Sciences.
"A UML sequence diagram or SD is similar to an MSC but written with a different notation. Presumably the same semantic issues arise, but possibly not since UML semantics are not well-defined. An example is shown in Figure 5.
The timelines are dotted rather than solid, and the name of the component is inside a box at the head of each timeline. The narrow rectangles apparently show when a component is active (unsure precisely what "active" means). An X on a timeline indicates that the component ceases to exist in some sense (unsure precisely how this is meant also). In the example, the Bank timeline has an X simply as an example (presumably the Bank does continue to exist)."
[www.ics.uci.edu/ ~alspaugh/ cls/ shr/ msc.html]
This example of bank ATM sequence diagram was created using the ConceptDraw PRO diagramming and vector drawing software extended with the ATM UML Diagrams solution from the Software Development area of ConceptDraw Solution Park.
Bank ATM UML sequence diagram
UML Class Diagram Example - Buildings and Rooms

Infographic Generator
- Project Plan Timeline Example
- Project Timeline | Timeline Examples | Examples of Flowcharts, Org ...
- Timeline Diagrams | Timeline Examples | How to Create a Timeline ...
- Timeline Diagrams | How to Make a Timeline | How to Create a ...
- | Timeline Diagrams | Manufacturing and Maintenance | Timelines ...
- Timeline Examples | How to Create a Timeline Diagram in ...
- Project timeline diagram - New business project plan | How to ...
- Timeline Drawing Examples
- Timeline Diagrams | Timeline Examples | Timeline Diagrams ...
- How to Make a Timeline | Timeline Examples | Design elements ...
- Timeline Diagrams | Value stream map example | Business ...
- How to Create a Timeline Diagram in ConceptDraw PRO | Timeline ...
- Timeline diagram | How to Create a Timeline Diagram in ...
- Project Timeline | Gant Chart in Project Management | How to Use ...
- Examples of Flowcharts, Org Charts and More | Program Evaluation ...
- Project plan timeline - Request for proposal (RFP) | PERT chart ...
- Example Of Project Proposal Diagram
- Communication Tool for Remote Project Management | Project ...
- How to Create a Timeline Diagram in ConceptDraw PRO | Timeline ...
- Project Timeline | Program Evaluation and Review Technique ...