HelpDesk
How To Create an Affinity Diagram Using Solutions
The affinity diagram is designed to prepare the data for further analysis of the cause-effect relationships. The Affinity diagram shows the structure of large, complex factors that have an influence on a problem, and then divides them up into a smaller and simpler structure. We recommend using a mind map for Brainstorming and collecting the factors affecting the problem. The ability to create an Affinity diagram from a mind map is supported by the ConceptDraw Seven Management and Planning Tools solution.Affinity Diagram Software
Affinity Diagram Software - ConceptDraw DIAGRAM is a powerful diagramming and vector drawing software that allows quick, easy and effective create the Affinity Diagrams.Seven Management and Planning Tools solution from the Business Productivity area of ConceptDraw Solution Park provides templates, samples and ready-to-use vector stencils that will help you design the professional looking Affinity Diagrams in a few moments.
Authority Matrix Diagram Software
You need to draw Authority Matrix Diagram quick and easy? Design it with ConceptDraw DIAGRAM!ConceptDraw DIAGRAM extended with Seven Management and Planning Tools solution from the Management Area is the best Authority Matrix Diagram Software.
House of Quality Matrix Software
House of Quality Matrix Software - Use the predesigned objects from the Involvement Matrix Objects Library from the Seven Management and Planning Tools Solution to create professional looking House of Quality Matrices in minutes.Onion Diagram Maker
The onion diagram is a type of diagram which shows the dependencies among parts of an organization or process. The items are displayed at the concentric circles, where the items at the bigger rings depend on the items at the smaller rings.ConceptDraw DIAGRAM diagramming and vector drawing software extended with Stakeholder Onion Diagrams Solution from the Management Area of ConceptDraw Solution Park is a professional Onion Diagram Maker.
Risk Diagram (Process Decision Program Chart)
Analyze each identified action separately in the tree of all actions and then develop a preventive action in response to potential obstacles or circumstances have been identified as a risk.The PDPC determines the risks when corrective action is not performed correctly. Also, it helps develop descriptions for preventive actions at the level of execution.
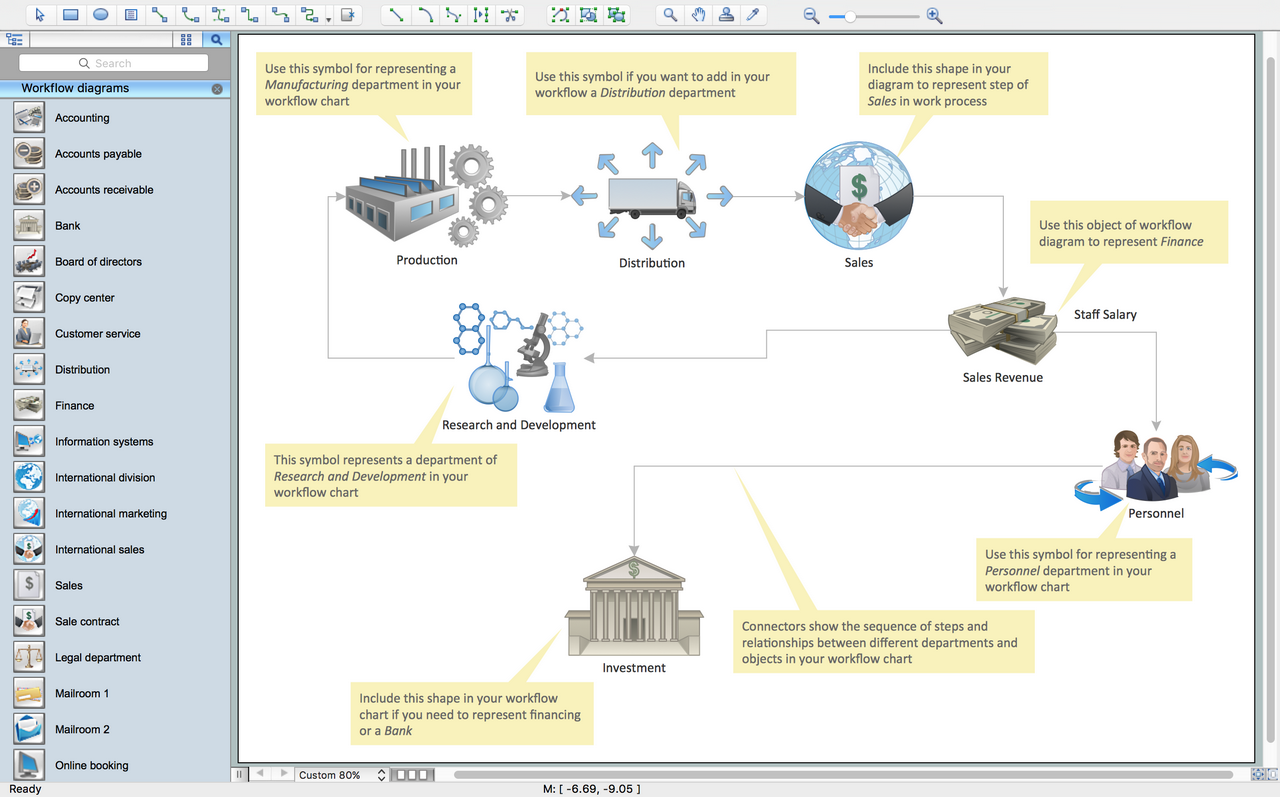
Create Workflow Diagram
In any unclear situation create a workflow diagram. Workflow diagrams help to understand processes, find bottlenecks and fix the process. When you create workflow diagram using ConceptDraw DIAGRAM software you are able to focus on thinking, not drawing, that makes you as effective as possible.Program Evaluation and Review Technique (PERT) with ConceptDraw DIAGRAM
PERT Diagram is a more realistic approach of a project's time estimate analysis. After PERT chart was constructed user can discover the shortest possible duration for entire project timescale. The project timeline is the longest chain that might be taken with connected tasks on the PERT Diagram. Completion of serial tasks need to be accomplished in a presented order. At a project timeline can be independent tasks that not linked with main sequence they are called parallel tasks. PERT diagram is more suitable for Critical Path Analysis than Gantt chart for the reason that it undoubtedly better determine task dependencies. Project managers customarily utilize both methodologies.Influence Diagram Software
Influence diagram (ID) is a graphical and mathematical representation of the decision. Influence diagrams are widely used in the decision analysis and in the game theory. They are the alternative to the decision tree. The influence diagram gives to analyst the high-level conceptual view that it can use to build the detailed quantitative model.This sample shows the Influence diagram. It is a directed acyclic graph with three types of nodes: Decision node is drawn as a rectangle, Uncertainty node is drawn as an oval, Value node is drawn as an octagon. The nodes are connected with arcs.
Sales Process Flowchart. Flowchart Examples
Create your own flow charts of sales business processes using the ConceptDraw DIAGRAM diagramming and vector drawing software extended with the Cross-Functional Flowcharts solution from the Business Processes area or Sales Flowcharts from the Marketing area of ConceptDraw Solution Park.- Component Of An Influence Diagram In Decision Analysis
- Affinity diagram - Implementing continuous process improvement ...
- How To Create Risk Diagram (PDPC) | Risk Diagram (Process ...
- Affinity diagram - Implementing continuous process improvement ...
- Affinity diagram - Implementing continuous process improvement
- Architectural Matrix Diagram Maker
- Onion Diagram Maker | How To Create Onion Diagram | Onion ...
- Interaction Overview Diagram | UML Component Diagram Example ...
- How To Create an Affinity Diagram Using ConceptDraw Office | How ...
- Activity on Node Network Diagramming Tool | Fully Connected ...
- ERD | Entity Relationship Diagrams, ERD Software for Mac and Win
- Flowchart | Basic Flowchart Symbols and Meaning
- Flowchart | Flowchart Design - Symbols, Shapes, Stencils and Icons
- Flowchart | Flow Chart Symbols
- Electrical | Electrical Drawing - Wiring and Circuits Schematics
- Flowchart | Common Flowchart Symbols