This site uses cookies. By continuing to browse the ConceptDraw site you are agreeing to our Use of Site Cookies.
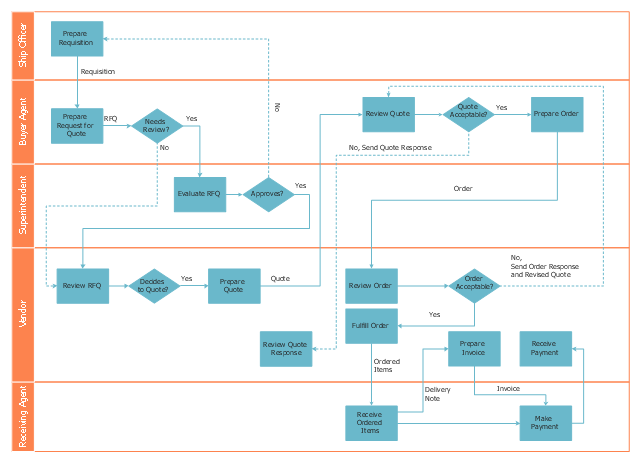
This deployment flow chart sample shows the trading process flow.
"Trade, also called goods exchange economy, is to transfer the ownership of goods from one person or entity to another by getting something in exchange from the buyer. Trade is sometimes loosely called commerce or financial transaction or barter. A network that allows trade is called a market. ...
Modern traders ... generally negotiate through a medium of exchange, such as money. As a result, buying can be separated from selling, or earning. ...
Retail trade consists of the sale of goods or merchandise from a very fixed location, such as a department store, boutique or kiosk, or by mail, in small or individual lots for direct consumption by the purchaser. Wholesale trade is defined as the sale of goods that are sold merchandise to retailers, to industrial, commercial, institutional, or other professional business users, or to other wholesalers and related subordinated services." [Trade. Wikipedia]
The swim lane diagram example "Deployment flowchart - Trading process diagram" was created using the ConceptDraw PRO diagramming and vector drawing software extended with the Cross-Functional Flowcharts solution from the Business Processes area of ConceptDraw Solution Park.
Swim lane diagram
Swim lane diagram, swim lanes, horizontal swimlanes, process, decision,

Settlement Process Flowchart. Flowchart Examples

Create your own flow charts of settlement processes using the ConceptDraw DIAGRAM diagramming and vector drawing software extended with the Cross-Functional Flowcharts solution from the Business Processes area of ConceptDraw Solution Park.
Download easy flowchart software to create settlement process flowcharts show steps of monthly settlement with your business quickly and easily.

Powerful Drawing Feature for Creating Professional Diagrams

This will let you create professional diagrams and charts using its simple RapidDraw option just in clicks. Take a look on a diagram you are looking for and create it fast and quickly.

Cross-Functional Flowcharts in ConceptDraw

Use ConceptDraw DIAGRAM enhanced with solutions from ConceptDraw Solution Park to create diagrams to present and explain structures, process flows, logical relationships and networks.

UML Class Diagram Generalization Example UML Diagrams

This sample was created in ConceptDraw DIAGRAM diagramming and vector drawing software using the UML Class Diagram library of the Rapid UML Solution from the Software Development area of ConceptDraw Solution Park.
This sample describes the use of the classes, the generalization associations between them, the multiplicity of associations and constraints. Provided UML diagram is one of the examples set that are part of Rapid UML solution.

Target Diagram

Target Diagram is a convenient and visual way of presentation information which is popular and widely used in marketing, business and economics. ConceptDraw DIAGRAM diagramming and vector drawing software extended with Target and Circular Diagrams solution from the Marketing area of ConceptDraw Solution Park is ideal for fast and easy drawing a Target Diagram.

How to Draw an Organization Chart

How to Draw an Organization Chart - The innovative ConceptDraw Arrows10 Technology included in ConceptDraw DIAGRAM is a powerful drawing tool that changes the way diagrams are produced.
While making the drawing process easier and faster.
Video tutorial on creating orgchart with ConceptDraw products. Try ConceptDraw for creating orgchart professional presentations!

UML Diagram

UML defines 13 types of diagrams: class (package), object, use case, sequence, collaboration, component, state machine, timing, interaction overview, composite structure, activity, and deployment.
Create unified modeling language (UML) diagrams with ConceptDraw.

SSADM Diagram

The vector stencils library SSADM from the solution Systems engineering contains specific symbols of SSADM diagrams for ConceptDraw DIAGRAM diagramming and vector drawing software. The Systems engineering solution is contained in Software Development area of ConceptDraw Solution Park.
The example below illustrates the waterfall model used in SSADM. This model involves 5 stages of developing a product such as requirements specification and its' analysis, design, coding and testing.

Audit Process Flowchart. Audit Flowchart

Audit Process Flowchart, Audit Flowchart - Audit Flowcharts solution for ConceptDraw DIAGRAM Solution Park provides the Audit Flowcharts library with wide variety of predesigned audit flowchart symbols, and also the set of templates and samples allowing you design your own audit flowchart or audit process flowchart in one moment. Simply use any of offered samples and change it for your needs, or fill the desired template.

Block Diagram

The vector stencils libraries: Block Diagrams, Blocks with Perspective, Callouts, Connectors, Raised Blocks from the solution Block Diagrams contain specific block diagram symbols such as arrows, input/output symbols, start/end symbols, processing symbols, conditional symbols, commenting symbols, callouts, connectors, etc. for ConceptDraw DIAGRAM diagramming and vector drawing software. The Block Diagrams solution is contained in a "Diagrams" area of ConceptDraw Solution Park.
Use the libraries from the Block Diagrams solution to draw block diagrams for your business documents, presentations and websites in a few minutes.

Mechanical Drawing Symbols

Mechanical Engineering solution — 8 libraries are available with 602 commonly used mechanical drawing symbols in Mechanical Engineering Solution, including libraries called Bearings with 59 elements of roller and ball bearings, shafts, gears, hooks, springs, spindles and keys; Dimensioning and Tolerancing with 45 elements; Fluid Power Equipment containing 113 elements of motors, pumps, air compressors, meters, cylinders, actuators and gauges; Fluid Power Valves containing 93 elements of pneumatic and hydraulic valves (directional control valves, flow control valves, pressure control valves) and electrohydraulic and electropneumatic valves; as well as many other sophisticated symbols and templates for your use.

Purchase Process Flow Chart, Receiving Process Flow Chart, Accounting Flowchart Example.

The purchasing process follows very specific guidelines and includes a purchasing cycle flowchart and receiving process flow chart. Common key elements of purchasing process.
It is important to know how purchasing processes work and how each operation is done.

Functional Flow Block Diagram

You need to draw a Functional Flow Block Diagram? You are an artist? Now it doesn't matter. With Block Diagrams solution from the "Diagrams" area for ConceptDraw Solution Park you don't need more to be an artist to design the Functional Flow Block Diagram of any complexity.

Sales Process Flowchart. Flowchart Examples

Create your own flow charts of sales business processes using the ConceptDraw DIAGRAM diagramming and vector drawing software extended with the Cross-Functional Flowcharts solution from the Business Processes area or Sales Flowcharts from the Marketing area of ConceptDraw Solution Park.

Approval Process and Segregation of Responsibilities Accounting Flowchart Example

How to build segregation of duties using drawing tools from Accounting Flowcharts Solution for ConceptDraw DIAGRAM software.

Offensive Formation – T-Formation – Diagram

Visual depiction of American Football schemas is key secret to successful understanding game details. Offensive and defensive formations can be easily drawn using ConceptDraw DIAGRAM software enhanced with the Football solution from the ConceptDraw Solution Park.

Cross Functional Flowchart for Business Process Mapping

Start your business process mapping with conceptDraw DIAGRAM and its Arrows10 Technology. Creating a process map, also called a flowchart, is a major component of Six Sigma process management and improvement. Use Cross-Functional Flowchart drawing software for business process mapping (BPM).

Use a variety of drawing tools, smart connectors and shape libraries to create flowcharts of complex processes, procedures and information exchange. Define and document basic work and data flows, financial, production and quality management processes to increase efficiency of you business.

Cross-functional flowchart landscape, U.S. units

In Cross-Functional Flowchart first step is to determine how many lanes you want to represent and what the lane titles will be. The choice of vertical or horizontal swim lanes landscape comes down to personal choice or just plain “what fits best”.

With ConceptDraw, we make that simple by including different swim lanes templates.
Professional looking examples and templates of Swimlane Flowchart which help you create Cross Functional Flowcharts rapidly.

Yourdon and Coad Diagram

The vector stencils library Yourdon and Coad Notation from the solution OOAD contains specific symbols of the Yourdon and Coad notation such as data store symbol, data process symbol, loop symbol for ConceptDraw DIAGRAM diagramming and vector drawing software. The OOAD solution is contained in the Software Development area of ConceptDraw Solution Park.