Target Diagram

HelpDesk
How to Draw a Circle-Spoke Diagram Using ConceptDraw PRO

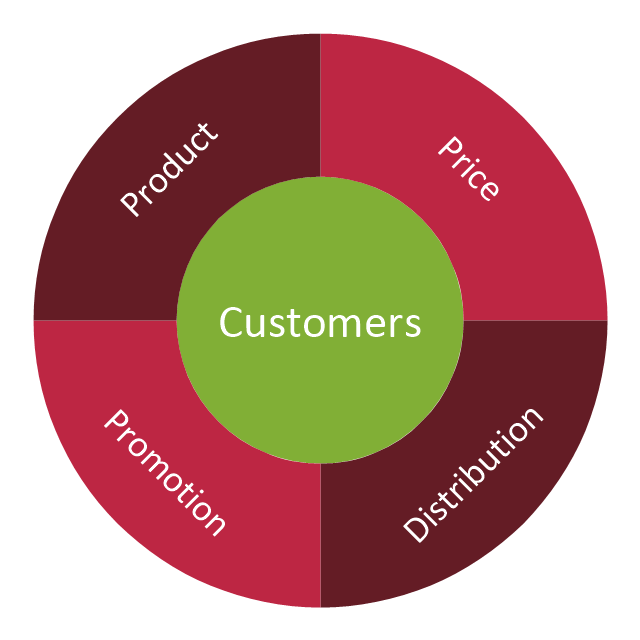
"The marketing mix is a business tool used in marketing and by marketing professionals. The marketing mix is often crucial when determining a product or brand's offer, and is often synonymous with the four Ps: price, product, promotion, and place ..." [Marketing mix. Wikipedia]
The example of wheel diagram (ring diagram, bevel style circle diagram, circular diagram) "Marketing mix" was created using the ConceptDraw PRO diagramming and vector drawing software extended with the Target and Circular Diagrams solution from the Marketing area of ConceptDraw Solution Park.
www.conceptdraw.com/ solution-park/ marketing-target-and-circular-diagrams
Marketing mix - Wheel diagram
How to Build Cloud Computing Diagram Principal Cloud Manufacturing

Onion Diagram Maker

How To Create Onion Diagram

 Target and Circular Diagrams
This solution extends ConceptDraw PRO software with samples, templates and library of design elements for drawing the Target and Circular Diagrams.
 Bubble Diagrams
Bubble diagrams have enjoyed great success in software engineering, architecture, economics, medicine, landscape design, scientific and educational process, for ideas organization during brainstorming, for making business illustrations, presentations, planning, design, and strategy development. They are popular because of their simplicity and their powerful visual communication attributes.
HelpDesk
How to Create a Stakeholder Onion Diagram

Keyboard Shortcuts and Mouse Actions

Basic Flowchart Symbols and Meaning


 Circular Arrows Diagrams
Circular Arrows Diagrams solution extends ConceptDraw PRO v10 with extensive drawing tools, predesigned samples, Circular flow diagram template for quick start, and a library of ready circular arrow vector stencils for drawing Circular Arrow Diagrams, Segmented Cycle Diagrams, and Circular Flow Diagrams. The elements in this solution help managers, analysts, business advisers, marketing experts, scientists, lecturers, and other knowledge workers in their daily work.
Onion Diagram Process Design

Circular Arrow

- Marketing mix - Wheel diagram | Marketing Diagrams | Promotion ...
- Marketing mix - Wheel diagram | Target Diagram | Daily Schedule ...
- Marketing mix - Wheel diagram | Marketing Diagrams | Marketing ...
- Marketing mix - Wheel diagram
- Marketing mix - Wheel diagram | Target diagrams - Vector stencils ...
- Marketing | Marketing mix - Wheel diagram | Target market ...
- Brand essence model - Wheel diagram | Competitor Analysis ...
- Target Diagram | Circle-Spoke Diagrams | Brand essence model ...
- Marketing mix - Wheel diagram | Competitor Analysis | Marketing ...
- Marketing mix - Wheel diagram | Competitor Analysis | Marketing ...
- Marketing mix - Wheel diagram | Marketing | Circle-spoke diagram ...
- Brand essence model - Wheel diagram | Marketing mix - Wheel ...
- Competitor Analysis | Brand essence model - Wheel diagram ...
- Target Diagram | How to Draw a Circle-Spoke Diagram Using ...
- Marketing mix - Wheel diagram | Marketing mix diagram | Target ...
- Marketing mix - Wheel diagram
- Marketing mix - Wheel diagram | Marketing mix - Wheel diagram ...
- Marketing mix - Wheel diagram | Marketing | Competitor Analysis ...
- Marketing Diagrams | Competitor Analysis | Marketing mix - Wheel ...