"Brand essence is a phrase that communicates the fundamental nature of a trade name associated with one or more products made by the same company. A business marketing team will often spend considerable time developing effective ways of expressing the brand essence of their company's various brands by highlighting the unique benefits provided that pertain to the values of its target subculture." [businessdictionary.com/ definition/ brand-essence.html]
Brand essence model diagram visually display key points of brand essence in easy to understand form.
The example of wheel diagram (ring diagram, bevel style circle diagram) "Brand essence model" was created using the ConceptDraw PRO diagramming and vector drawing software extended with the Target and Circular Diagrams solution from the Marketing area of ConceptDraw Solution Park.
www.conceptdraw.com/ solution-park/ marketing-target-and-circular-diagrams
Wheel diagram

 Marketing
This solution extends ConceptDraw PRO v9 and ConceptDraw MINDMAP v7 with Marketing Diagrams and Mind Maps (brainstorming, preparing and holding meetings and presentations, sales calls).
The vector stencils library "Sales KPIs and Metrics" contains 15 chart templates and graphic indicators of sales key performance indicators (KPIs) and metrics.
Use it for drawing sales dashboards in the ConceptDraw PRO diagramming and vector drawing software extended with the Sales Dashboard solution from the Marketing area of ConceptDraw Solution Park.
Use it for drawing sales dashboards in the ConceptDraw PRO diagramming and vector drawing software extended with the Sales Dashboard solution from the Marketing area of ConceptDraw Solution Park.
Actual vs Plan

Average Purchase Value

Clicks from Sales Follow-Up Emails

Cost per customer

Cost per order

Lead Response Time

Opportunity-to-Win Ratio

Product mix

Product Performance

Rate of Contact

Rate of Follow Up Contact

Sales Growth

Sales Target

Social Media Usage

Usage Rate of Marketing Collateral

This onion diagram sample was created on the base of the figure "Social Ecological Model (SEM)" illustrating the webpage "Cultural Competence" from the US Centers for Disease Control and Prevention (CDC) website.
"Why consider cultural competence?
It is important to communicate effectively to both the disparately affected population(s) of interest as well as other key stakeholders at the community, state, and national levels.
The diagram of the Social Ecological Model (SEM) ... depicts how health behaviors of an individual (inner oval) are influenced by the interpersonal, organizational, community, and public policy contexts and environment in which that person exists. Cultural context resides in the interpersonal band, making it a critical consideration when designing any communication plan. All obesity prevention communications should take the culture (e.g., language, thoughts, communications, actions, customs, beliefs, values, and institutions of racial, ethnic, religious, or social groups) of the target population into consideration to be effective. Interventions that successfully achieve this goal demonstrate cultural competence - behaviors, attitudes, and policies that come together in a system, agency, or among professionals to enable people to work effectively in a cross-cultural situation."
[cdc.gov/ obesity/ health_ equity/ culturalRelevance.html]
The onion diagram example "Social Ecological Model (SEM)" was created using the ConceptDraw PRO diagramming and vector drawing software extended with the Target and Circular Diagrams solution from the Marketing area of ConceptDraw Solution Park.
www.conceptdraw.com/ solution-park/ marketing-target-and-circular-diagrams
Onion diagram
---onion-diagram.png--diagram-flowchart-example.png)
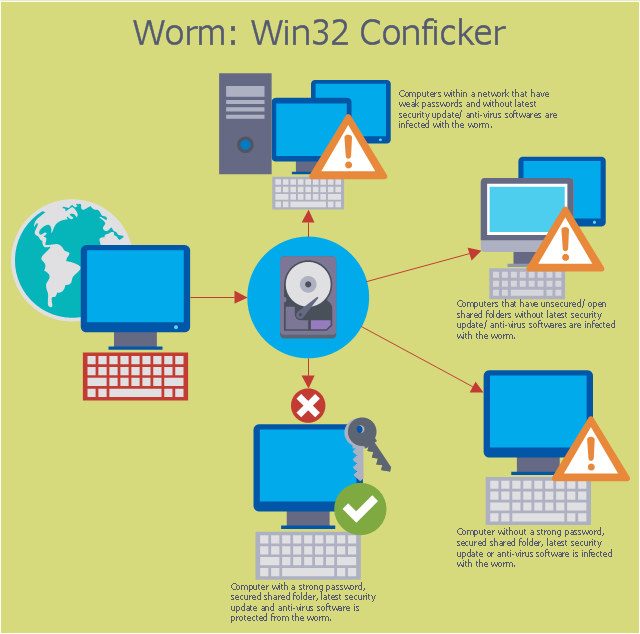
This computer security diagram example was designed on the base of the Wikimedia Commons file: Conficker.svg. [commons.wikimedia.org/ wiki/ File:Conficker.svg]
This file is licensed under the Creative Commons Attribution-Share Alike 3.0 Unported license. [creativecommons.org/ licenses/ by-sa/ 3.0/ deed.en]
"A computer worm is a standalone malware computer program that replicates itself in order to spread to other computers. Often, it uses a computer network to spread itself, relying on security failures on the target computer to access it. Unlike a computer virus, it does not need to attach itself to an existing program. Worms almost always cause at least some harm to the network, even if only by consuming bandwidth, whereas viruses almost always corrupt or modify files on a targeted computer." [Computer worm. Wikipedia]
The cybersecurity diagram example "Spread of Conficker worm" was created using the ConceprDraw PRO software extended with the Network Security Diagrams solution from the Computer and Neworks area of ConceptDraw Solution Park.
Computer security diagram
 Spatial Infographics
Spatial infographics solution extends ConceptDraw PRO software with infographic samples, map templates and vector stencils libraries with design elements for drawing spatial information graphics.
 PM Dashboards
This solution extends ConceptDraw PRO and ConceptDraw PROJECT software with the ability to clearly display the identified key performance indicators for any project.
Databases Access Objects Model with ConceptDraw PRO

The cycle diagram sample was created on the base of the figure illustrating the webpage "2. POLICY & STRATEGY" of "Scottish Police College Primary Inspection 2006: A Report by Her Majesty's Inspectorate of Constabulary" from the Scottish Government website.
"Strategic Planning.
2.1 The planning process for the College currently follows a structured approach, starting in April and extending through the financial year. The planning cycle is illustrated in figure 2. ...
2.2 The College recognises the need to consult with its customers and stakeholders in the process of setting objectives and directing the training programme. The planning cycle to date refers to force visits, environmental scanning, the course planning process which involves consultation with all forces and other common police services, as well as to a survey of external providers.
2.3 The information from consultation feeds into an EFQM framework from which the College has identified four key policies, namely:
(1) developing and delivering quality training;
(2) developing our people through lifelong learning;
(3) continuous improvement of our service; and
(4) embracing the changing environment.
2.4 The objectives set at divisional level are designed to contribute to delivering these policies. HMIC found that whilst the selected objectives were presented in line with the structure, not all could be considered to meet SMART (Specific, Measurable, Achievable, Relevant and Timed) criteria. This failure indicates that while the process appears suitably structured to deliver a robust result, some of those involved could perhaps have a better understanding of the process." [scotland.gov.uk/ Publications/ 2007/ 02/ 15134652/ 8]
The cycle diagram example "Strategic planning" was created using the ConceptDraw PRO diagramming and vector drawing software extended with the Target and Circular Diagrams solution from the Marketing area of ConceptDraw Solution Park.
www.conceptdraw.com/ solution-park/ marketing-target-and-circular-diagrams
Cycle diagram

- Timeline Indicating Key Targets And Deadlines Of A Business
- Sales Dashboard | Timelines Indicating Key Targets And Deadlines ...
- Draw Timeline And Indicating Key Targets And Deadline
- Timeline Indicating Key Targets And Deadlines Of A Business Plan
- Business Timeline Indicating Key Targets And Deadlines
- Timeline Indicating Key Targets And Deadlines
- What are Infographic Area | Sales Dashboard | Timelines Indicating ...
- Timeline Indicating Key Targets And Busines
- Timelines Indicating Key Targets And Deadlines When You Have A ...
- Restaurants Timeline Indicate Key Targets And Deadline Of
- Time Line Indicating Key Targets And Deadlines Of A Business Plan
- Timelines Indicating Targetsand Deadlines Of A Business
- Example Of Timelines Indicating Key Targets And Deadlines
- Timelines Indicating Key Targets And Deadlines Of A Business
- Key Targets And Deadlines Of A Business
- What are Infographic Area | Sales Dashboard | A Restaurant ...
- What are Infographic Area | Sales Dashboard | Business Processes ...
- Key Perfornace Indicators Charts
- Sales KPIs and Metrics - Vector stencils library | Design elements ...
- Performance Indicators | What is a KPI? | KPI Dashboard | Key ...