This site uses cookies. By continuing to browse the ConceptDraw site you are agreeing to our Use of Site Cookies.

Diagramming Software for Design UML Communication Diagrams

UML Communication Diagram depicts the interactions between objects or parts in terms of sequenced messages and describes both the static structure and dynamic behavior of a system.
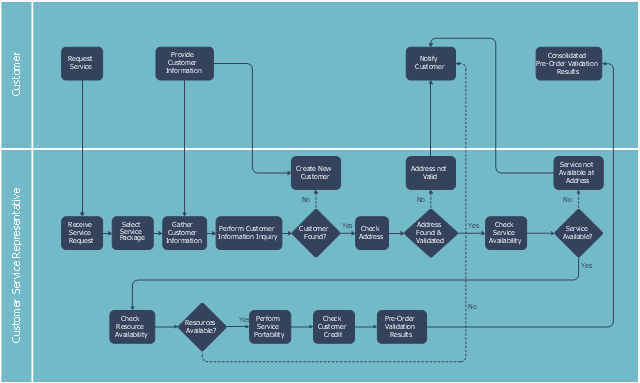
This swim lane diagram sample shows the telecom services process flow.
"Telecommunication is communication at a distance by technological means, particularly through electrical signals or electromagnetic waves. ...
Electrical and electromagnetic telecommunication technologies include telegraph, telephone, and teleprinter, networks, radio, microwave transmission, fiber optics, communications satellites and the Internet." [Telecommunication. Wikipedia]
"A telecommunications service provider or TSP is a type of communications service provider that has traditionally provided telephone and similar services. This category includes incumbent local exchange carriers, competitive local exchange carriers, and mobile wireless communication companies. ...
While some people use the terms "telecom service provider" and "communications service provider" interchangeably, the term TSP generally excludes Internet service providers (ISPs), cable companies, satellite TV, and managed service providers. ...
TSPs provide access to telephone and related communications services." [Telecommunications service provider. Wikipedia]
The cross-functional flowchart example "Providing telecom services" was created using the ConceptDraw PRO diagramming and vector drawing software extended with the Cross-Functional Flowcharts solution from the Business Processes area of ConceptDraw Solution Park.
Swin lane diagram
Swin lane diagram, swim lanes, horizontal swimlanes, process, decision,

Communication Diagram UML2.0 / Collaboration UML1.x

UML Communication diagramming software with rich examples and template. ConceptDraw is ideal for software designers and software developers who need to draw UML Communication Diagrams.

SDL Flowchart Symbols

Drawing the diagrams we try to find in help the powerful software and now we have the ConceptDraw DIAGRAM. The ability easily create the SDL diagrams is made possible thanks to unique Specification and Description Language (SDL) Solution from the Industrial Engineering Area of ConceptDraw Solution Park. This solution extends ConceptDraw DIAGRAM libraries - SDL Connectors and SDL Diagrams that contain 70 predesigned SDL flowchart symbols.

Digital Communications Network. Computer and Network Examples

The digital communication is a physical transfer of the data over a point-to-point or point-to-multipoint communication channel. Channels can be copper wires, optical fibres, wireless communication channels, etc. The data are realized as electromagnetic signals (radiowave, microwave, electrical voltage, etc.). This example was created in ConceptDraw DIAGRAM using the Computer and Networks Area of ConceptDraw Solution Park and shows the Digital Communication Network diagram.

How to Collaborate in Business via Skype

Collaboration software for small and medium business allows communicate with partners around the globe via Skype.

Flow Chart

A Flow Chart is a type of diagram which visualizes a process, algorithm of a program or workflow. The steps / operations are represented as boxes of various types and are connected by arrows which show the flow of the process. But how to design a Flow Chart fast and easy? We recommend to use a powerful ConceptDraw DIAGRAM diagramming and vector drawing software extended with Flowcharts Solution from the "Diagrams" Area of ConceptDraw Solution Park.

Database Flowchart Symbols

Data base diagrams describes inter-related data and tables. It describes roles and relationships, internal and external dependencies, data exchange conventions and structures of knowledge domain. ConceptDraw Software provides number of data-base chart libraries including major 49 vector symbols. Use these DFD flowchart symbol libraries to design data-base structure and models, use it to design data base process-oriented models, or simple data-oriented models. The are special drawing tools for making data flowcharts, data process diagrams, structured analysis diagrams, and information flow diagrams.

Why Flowchart Important to Accounting Information System?

The Accounting flowchart shows how information flows from source documents through the accounting records. The are based on the accounting procedures or processes. Flowcharts are used to represent accounting information in a system. There are special symbols which are used to create accounting flowcharts. Try conceptdraw flowcharting set of symbols to draw a professional charts.

Purchase Process Flow Chart, Receiving Process Flow Chart, Accounting Flowchart Example.

The purchasing process follows very specific guidelines and includes a purchasing cycle flowchart and receiving process flow chart. Common key elements of purchasing process. It is important to know how purchasing processes work and how each operation is done.

Telecommunications Network

How to draw Telecommunications Network Diagram quick, easy and effective? ConceptDraw DIAGRAM offers the unique Telecommunication Network Diagrams Solution from the Computer and Networks Area which will help you.

Flowchart

The Flowcharts are widespread in various fields and include the multitude of types. They are dedicated to representation the algorithms, processes, workflows of any complexity in a clear and intuitive format. The Flowcharts are commonly used in software development as a visual tool for illustration algorithms and logic of computer programs, in business for illustration business scenarios, in education, and so on. For drawing the Flowchart are used the special object blocks, among them rectangle or box used to represent an activity or step, rounded box or oval to depict Start / End, diamond to represent the decision point (involves the branching yes/no), circle used to represent the point of connection, parallelogram to represent the Input / Output, and some others. With ConceptDraw DIAGRAM including Flowcharts solution it is easy to create professional-looking Flowchart diagrams of any complexity and any degree of detailing. Succeed in drawing the Flowcharts using quick-start templates, predesigned samples and extensive libraries of ready-made flowchart symbols, blocks and icons.

Types of Flowcharts

A Flowchart is a graphical representation of process, algorithm, workflow or step-by-step solution of the problem. It shows the steps as boxes of various kinds and connects them by arrows in a defined order depicting a flow. There are twelve main Flowchart types: Basic Flowchart, Business Process Modeling Diagram (BPMN), Cross Functional Flowchart, Data Flow Diagram (DFD), IDEF (Integrated DEFinition) Flowchart, Event-driven Process Chain (EPC) Diagram, Influence Diagram (ID), Swimlane Flowchart, Process Flow Diagram (PFD), Specification and Description Language (SDL) Diagram, Value Stream Mapping, Workflow Diagram. Using the Flowcharts solution from the Diagrams area of ConceptDraw Solution Park you can easy and quickly design a Flowchart of any of these types. This solution offers a lot of special predesigned vector symbols for each of these widely used notations. They will make the drawing process of Flowcharts much easier than ever. Pay also attention for the included collection of ready Flowchart examples, samples and quick-start templates. This is business process improvement tools. If you are looking for MS Visio for your Mac, then you are out of luck, because it hasn't been released yet. However, you can use Visio alternatives that can successfully replace its functions. ConceptDraw DIAGRAM is an alternative to MS Visio for Mac that provides powerful features and intuitive user interface for the same.
How to Simplify Flow Charting

Process Flow Chart

A Process Flow Chart is a type of flowchart which is mostly used in industrial, chemical and process engineering for illustrating high-level processes, major plant processes and not shows minor details. ConceptDraw DIAGRAM diagramming and vector drawing software extended with Flowcharts Solution from the "Diagrams" Area of ConceptDraw Solution Park is the best way to create Process Flow Chart and other types of flowcharts.

Technical Flow Chart Example

What illustrates a technical flow chart? Technical flow chart is a diagrammatic representation which visually illustrates the sequence of operations that must to be performed to get the problem's solution. ConceptDraw DIAGRAM enhanced with Flowcharts Solution from the "Diagrams" Area of ConceptDraw Solution is a perfect software for drawing Technical Flow Chart Example illustrating the essence and importance of the technical flow chart use.

What Is an Action Mind Map

Interactive tool helps you find the appropriate response to social media mentions quickly.

Basic of Flowchart: Meaning and Symbols

Flowcharts are the best for visually representation the business processes and the flow of a custom-order process through various departments within an organization. ConceptDraw DIAGRAM diagramming and vector drawing software extended with Flowcharts solution offers the full set of predesigned basic flowchart symbols which are gathered at two libraries: Flowchart and Flowcharts Rapid Draw. Among them are: process, terminator, decision, data, document, display, manual loop, and many other specific symbols. The meaning for each symbol offered by ConceptDraw gives the presentation about their proposed use in professional Flowcharts for business and technical processes, software algorithms, well-developed structures of web sites, Workflow diagrams, Process flow diagram and correlation in developing on-line instructional projects or business process system. Use of ready flow chart symbols in diagrams is incredibly useful — you need simply drag desired from the libraries to your document and arrange them in required order. There are a few serious alternatives to Visio for Mac, one of them is ConceptDraw DIAGRAM. It is one of the main contender with the most similar features and capabilities.
How to Build a Flowchart

Processing Flow Chart

Processing Flow Chart is a simplified sketch which is used in chemical and process engineering for illustrating general plant streams, major equipments and key control loops.

ConceptDraw DIAGRAM enhanced with Flowcharts Solution from the "Diagrams" Area of ConceptDraw Solution Park is a powerful Processing Flow Chart software which will help save lots of your time.

Technical Flow Chart

Flow chart is a diagrammatic representation of an algorithm and essential part of planning the system. Flow charts are widely used in technical analysis and programming for easy writing programs and explaining them to others. So, one of the most popular type of flow charts is Technical Flow Chart. Technical Flow Chart can be drawn by pencil on the paper, but it will be easier to use for designing a special software. ConceptDraw DIAGRAM diagramming and vector drawing software extended with Flowcharts Solution from the "Diagrams" Area of ConceptDraw Solution Park will be useful for this goal.