Geo Map - USA - Montana
Montana is a state in the Western United States.The vector stencils library Montana contains contours for ConceptDraw PRO diagramming and vector drawing software. This library is contained in the Continent Maps solution from Maps area of ConceptDraw Solution Park.
Geo Map - USA - Alaska
Alaska is a U.S. state situated in the northwest extremity of the North American continent.The vector stencils library Alaska contains contours for ConceptDraw PRO diagramming and vector drawing software. This library is contained in the Continent Maps solution from Maps area of ConceptDraw Solution Park.
Geo Map - Canada - Manitoba
Manitoba is a Canadian prairie province.The vector stencils library Manitoba contains contours for ConceptDraw PRO diagramming and vector drawing software. This library is contained in the Continent Maps solution from Maps area of ConceptDraw Solution Park.
UML Use Case Diagram. Design Elements
UML Use Case Diagrams are used to illustrate the structure of arbitrarily complex systems and illustrates the service consumer - service provider relationship between components.
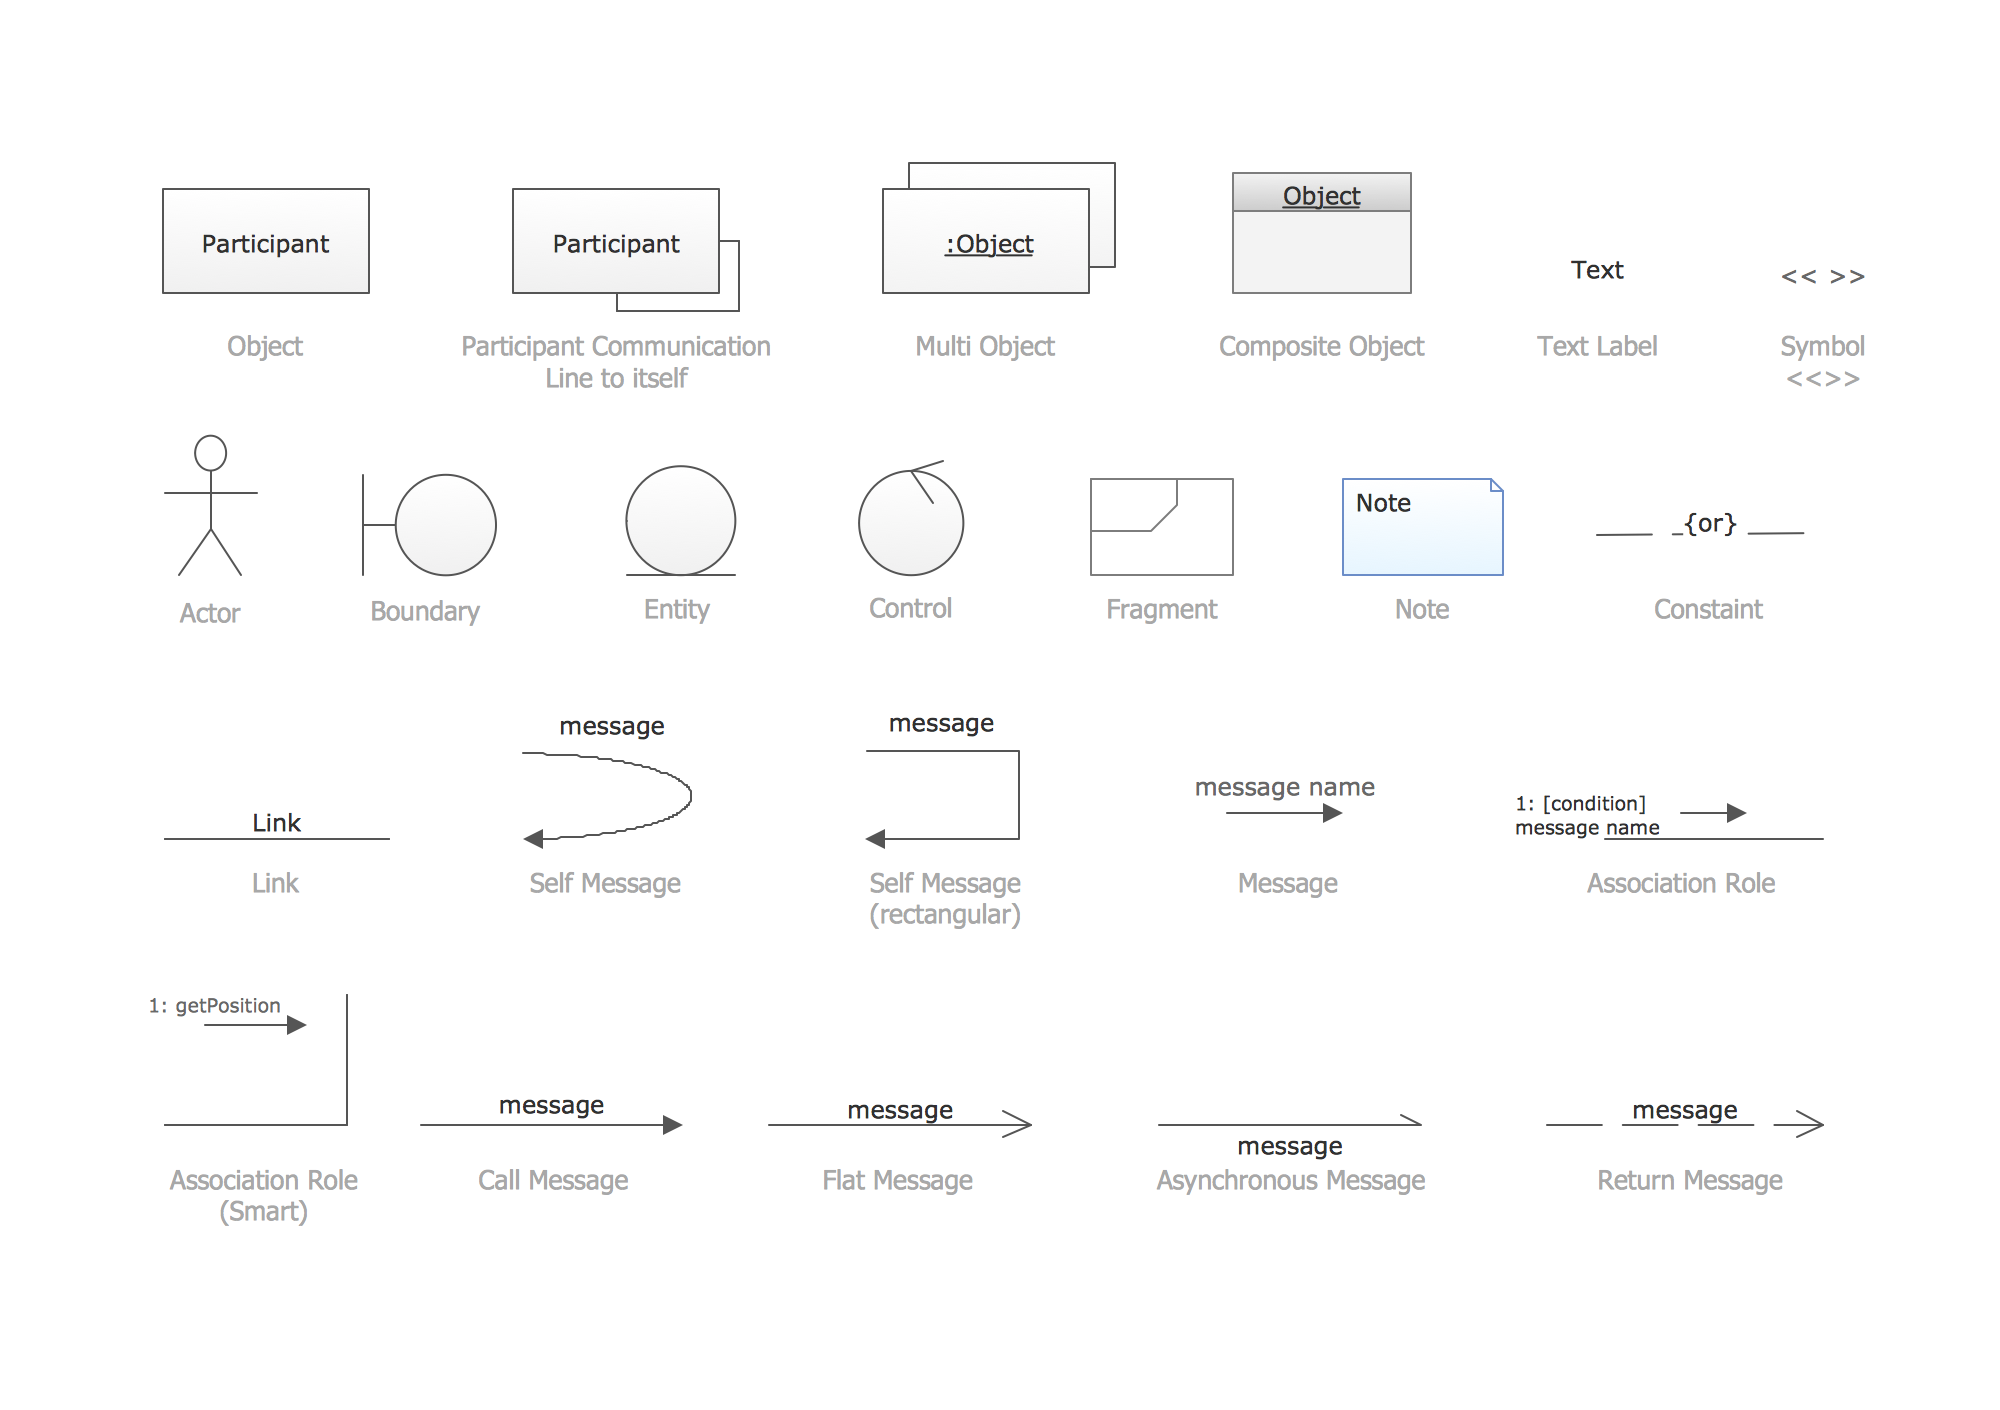
UML Collaboration Diagram. Design Elements
UML Collaboration Diagram illustrates how components are wired together to larger components and software systems that shows the structure of arbitrarily complex systems.ConceptDraw has 393 vector stencils in the 13 libraries that helps you to start using software for designing your own UML Diagrams. You can use the appropriate stencils of UML notation from UML Collaboration library with 36 objects
UML Collaboration Diagram (UML2.0)
UML Collaboration Diagram depicts the interactions between objects or parts in terms of sequenced messages and describes both the static structure and dynamic behavior of a system.Rapid UML solution provides templates, examples and libraries of stencils for quick and easy drawing all the types of system and software engineering diagrams according to UML 2.4 and 1.2 notations.

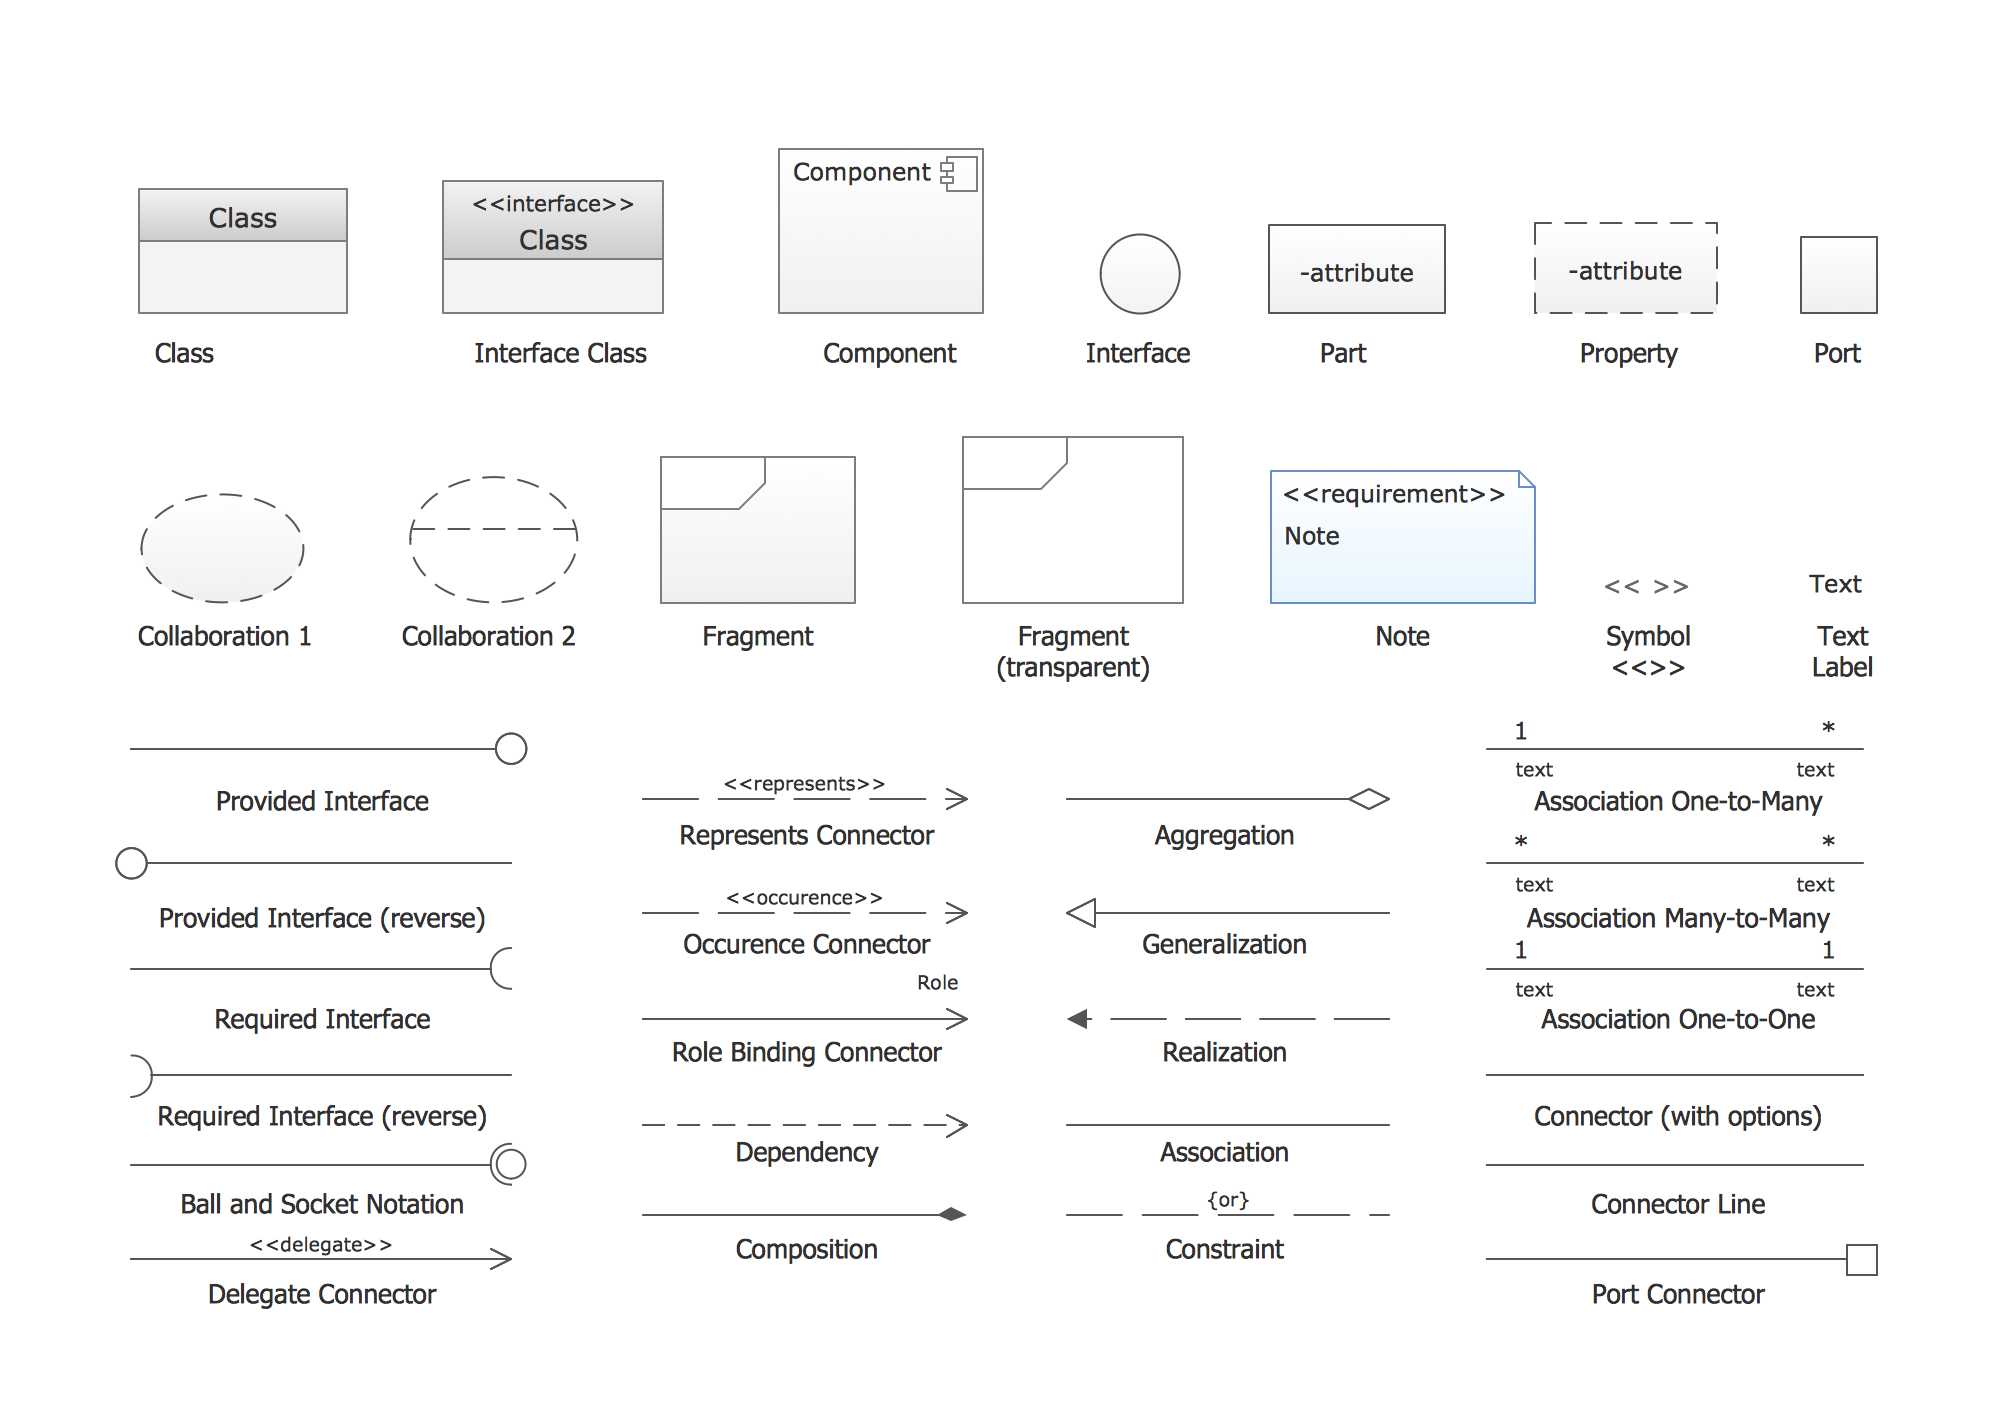
UML Composite Structure Diagram. Design Elements
UML Composite Structure Diagram shows the internal structure of a class and the possible interactions at this structure.ConceptDraw has 393 vector stencils in the 13 libraries that helps you to start using software for designing your own UML Diagrams. You can use the appropriate stencils of UML notation from UML Composite Structure library.
Netflow architecture. Computer and Network Examples
Netflow is a network protocol used for accounting the IP network traffic. It was developed by Cisco Systems. Now it is actually the industrial standard, it is supported by many devices. There are several versions of the protocol, but the most common are the versions 5 and 9.This diagram was created in ConceptDraw PRO using the Computer and Networks Area of ConceptDraw Solution Park and shows the Netflow architecture.

Sample Pictorial Chart. Sample Infographics
Sample Pictorial Chart - Pictorial Infographics solution provides easy-to-use design infographics drawing tools, large collection of different sample infographics and infograms, sample pictorial chart and templates to be filled in, and 10 libraries with great quantity of predesigned vector pictograms.Use Pictorial Infographics solution to draw your own design pictorial infographics documents quick and easy.
The Building Blocks Used in EPC Diagrams
Event-Driven Process Chain Diagrams is using for improvement throughout an organisation.ConceptDraw PRO - software that reduces the time needed to create a EPC diagrams.
Booch OOD Diagram
The vector stencils library Booch OOD from the solution Software Engineering contains specific symbols of the Booch method such as class symbols, association symbols, aggregation symbols for ConceptDraw PRO diagramming and vector drawing software. The Software Engineering solution is contained in the Software Development area of ConceptDraw Solution Park.Best Tool for Infographic Construction
ConceptDraw is a best data visualization tool that will allow everyone to create rich infographics and visualizations quickly and easily.HelpDesk
How to Draw a Pictorial Chart in ConceptDraw PRO
Pictorial Infographics is used to visually present data comparison. Pictorial charts use relative sizes or repetitions of the same icon, picture, or symbol to show data relation. Using a Pictorial chart to show business data patterns and trends will add much more efficiency to your business communications. Finding the right tool for the job can sometimes be tricky. Developing sophisticated and effective infographics can require toolsthat may span many different products. Fortunately, ConceptDraw PRO has everything you need to create polished Pictorial Infographics that beautifully and accurately represent your story, no matter how complex it may be.UML Class Diagram Notation
When it comes to system construction, a class diagram is the most widely used diagram. UML Class Diagrams is a type of static structure diagram that is used for general conceptual modeling of the systematics of the application. Such a diagram would illustrate the object-oriented view of a system . The object orientation of a system is indicated by a class diagram. It describes the structure of a system by showing the general issues,classes of a system, attributes, operations, interfaces, inheritance, and the relationships between them.Transportation Infographics
ConceptDraw is a visualization Software for making transportation infographics. Infographics design vector elements and vector graphics which will surely help you in your design process.- Transport map - Vector stencils library | Travel and tourism ...
- Travel and tourism pictograms - Vector stencils library | Basic ...
- Line Graphs | Bar Graphs | Line Graph Charting Software | Graph
- How to Draw a Pictorial Chart in ConceptDraw PRO | Sample ...
- Sample Pictorial Chart. Sample Infographics | How to Draw Pictorial ...
- Design elements - Travel and tourism pictograms | Travel and ...
- Design elements - Transport map | Design elements - Location map ...
- How to Draw a Pictorial Chart in ConceptDraw PRO | Sample ...
- Road signs - Vector stencils library | Design elements - Road signs ...
- How to Draw a Pictorial Chart in ConceptDraw PRO | Sample ...
- Sample Pictorial Chart. Sample Infographics | Design Pictorial ...
- Tourism in the world: key figures | Design Pictorial Infographics ...
- Line graph template - The number of tourists visiting the resort town ...
- Tourism Concepts Flowchart
- How to Draw a Pictorial Chart in ConceptDraw PRO | How to Draw ...
- Design elements - Transport pictograms | Design elements ...
- How to Draw a Pictorial Chart in ConceptDraw PRO | Process ...
- Sample Pictorial Chart. Sample Infographics | How to Draw a ...
- People pictograms - Vector stencils library | Design elements ...
- Management indicators - Vector stencils library | Education ...
