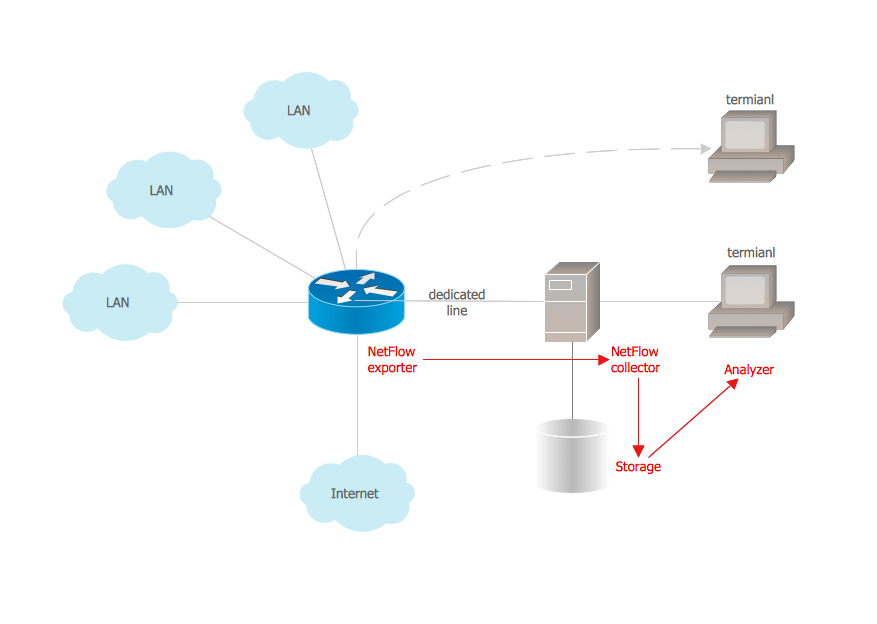
Example 1. Netflow architecture. Computer and Network Examples
This diagram was created in ConceptDraw DIAGRAM using the Computer and Networks Area of ConceptDraw Solution Park and shows the Netflow architecture.
Using the solutions of the Computer and Networks Area for ConceptDraw DIAGRAM you can create your own computer network diagrams quick and easy.
The diagrams designed with ConceptDraw DIAGRAM are vector graphic documents and are available for reviewing, modifying, and converting to a variety of formats (image, HTML, PDF file, MS PowerPoint Presentation, Adobe Flash or MS Visio).
See also Samples:
TEN RELATED HOW TO's:
ConceptDraw DIAGRAM diagramming and vector drawing software extended with Security and Access Plans Solution from the Building Plans Area of ConceptDraw Solution Park is a powerful software for fast and easy drawing professional looking Physical Security Plan.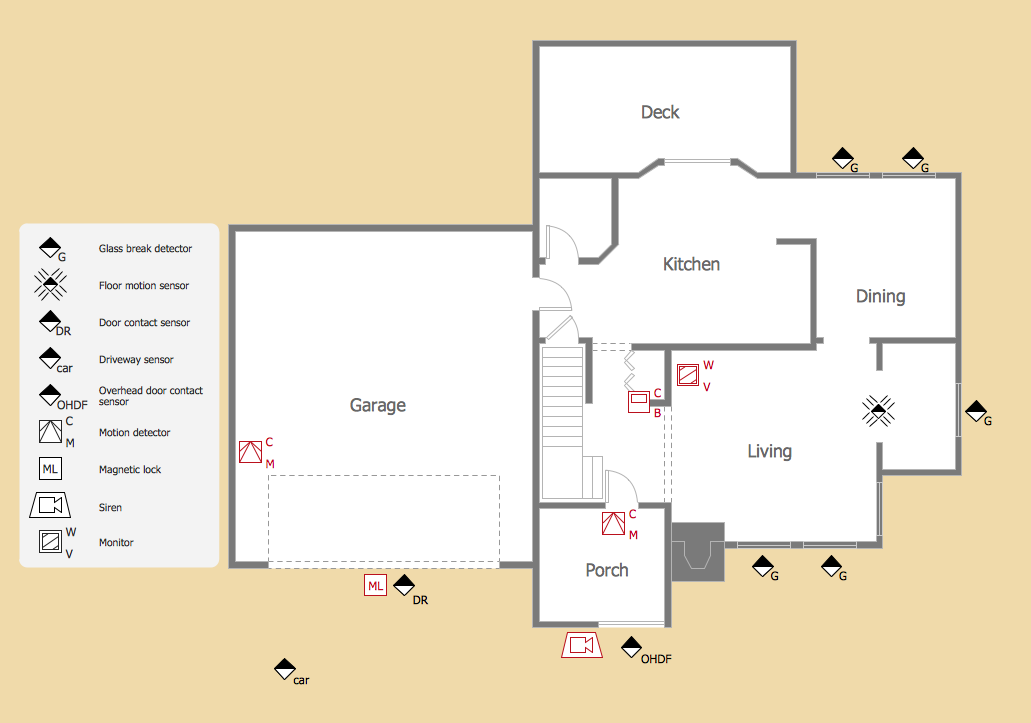
Picture: Physical Security Plan
Related Solution:
Electrical Engineering Solution used together with ConceptDraw DIAGRAM drawing facilities makes short a work of drawing various electrical and electronic circuit schemes. A library of vector objects composed from symbols of Analog and Digital Logic elements of electric circuit includes 40 symbolic images of logic gates, bistable switches of bi-stable electric current, circuit controllers, amplifiers, regulators, generators, etc. All of them can be applied in electronic circuit schemes for showing both analog and digital elements of the circuit.
Electrical Engineering Solution used together with ConceptDraw DIAGRAM drawing facilities makes short a work of drawing various electrical and electronic circuit schemes. A library of vector objects composed from symbols of Analog and Digital Logic elements of electric circuit includes 40 symbolic images of logic gates, bistable switches of bi-stable electric current, circuit controllers, amplifiers, regulators, generators, etc. All of them can be applied in electronic circuit schemes for showing both analog and digital elements of the circuit.
Picture:
Electrical Diagram Symbols F.A.Q.
How to Use Electrical ConceptDraw Diagram Software
Related Solution:
Planning a computer network can be a challenge for a junior specialist. However, knowing how to draw a computer network diagrams isn’t a rocket science anymore. There are a lot of special software for creating such diagrams with predesigned templates and examples.
The core for Network Fault Tolerance System presented here, is the equipment of Cisco. You can see here the certified Cisco equipment icons. Generally, ConceptDraw DIAGRAM libraries contain more than half of a thousand objects representing the standardized images of Cisco equipment. ConceptDraw solution for network diagramming is a great network diagramming tool for any level skills - from students to network guru.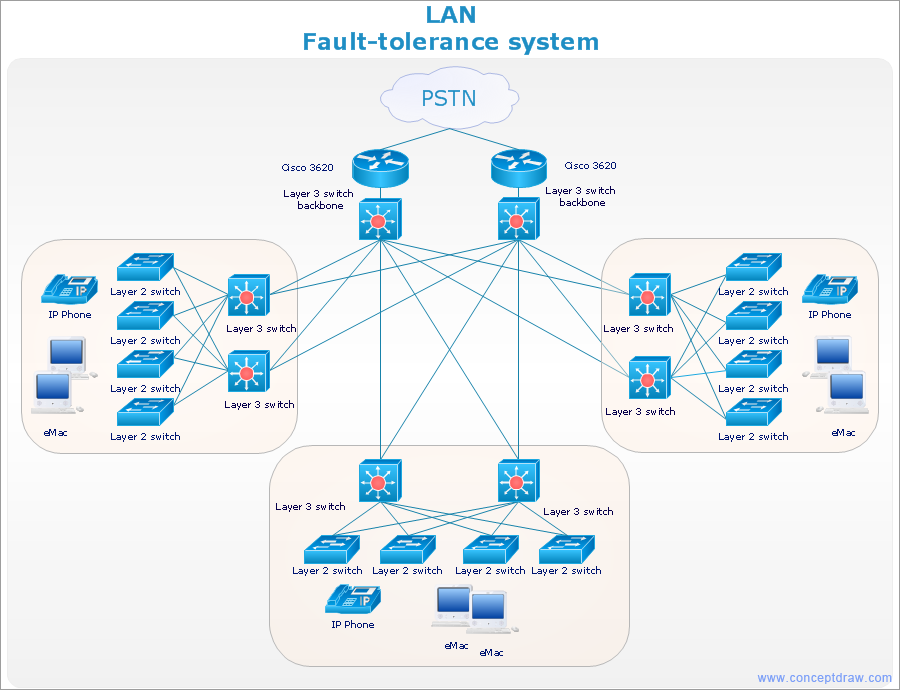
Picture: How to Draw a Computer Network Diagrams
Related Solution:
Studying informatics demands knowledge in the area of computer networks as well. The most famous world network, Internet, is an example of wide area network (WAN) topology that connects devices spread on any distance. Unlike other smaller networks that are limited to a building or to a campus, WAN is almost limitless.
This WAN (wide area network) diagram was created in ConceptDraw DIAGRAM. It shows a telecommunication network that covers a large geographical area connecting several settlements. This type of networks is commonly used by business and government institutions. Using the WANs enables them quickly communicate information between remote geographical points. To reproduce this network diagram, you will need the means, provided by ConceptDraw Computer and Network Diagrams solution.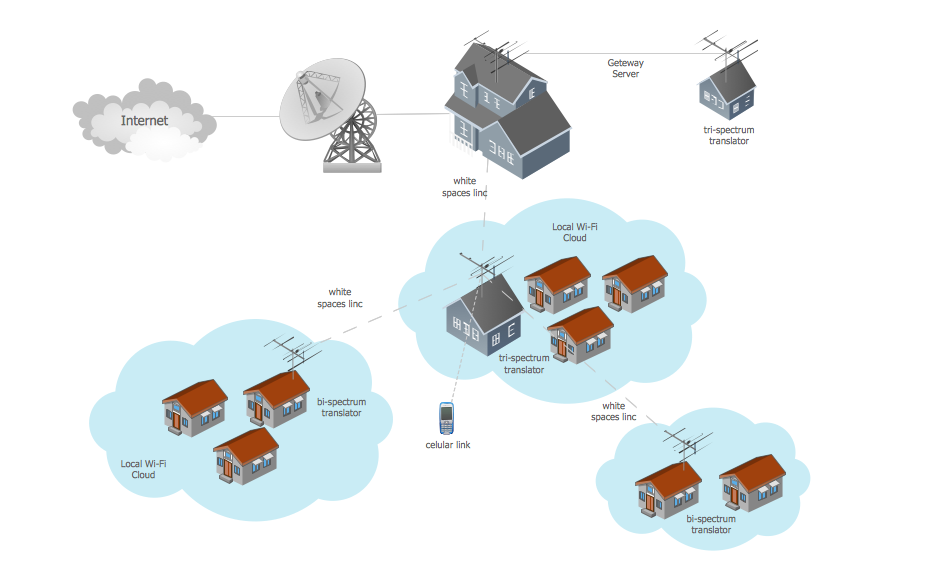
Picture: Wide area network (WAN) topology. Computer and Network Examples
Related Solution:
ConceptDraw DIAGRAM provides the Plant Layout Plans solution from the Building Plans Area of ConceptDraw Solution Park to develop: Plant layouts for production, Storage, Distribution, Transport, Shipping, Receiving of manufactured goods.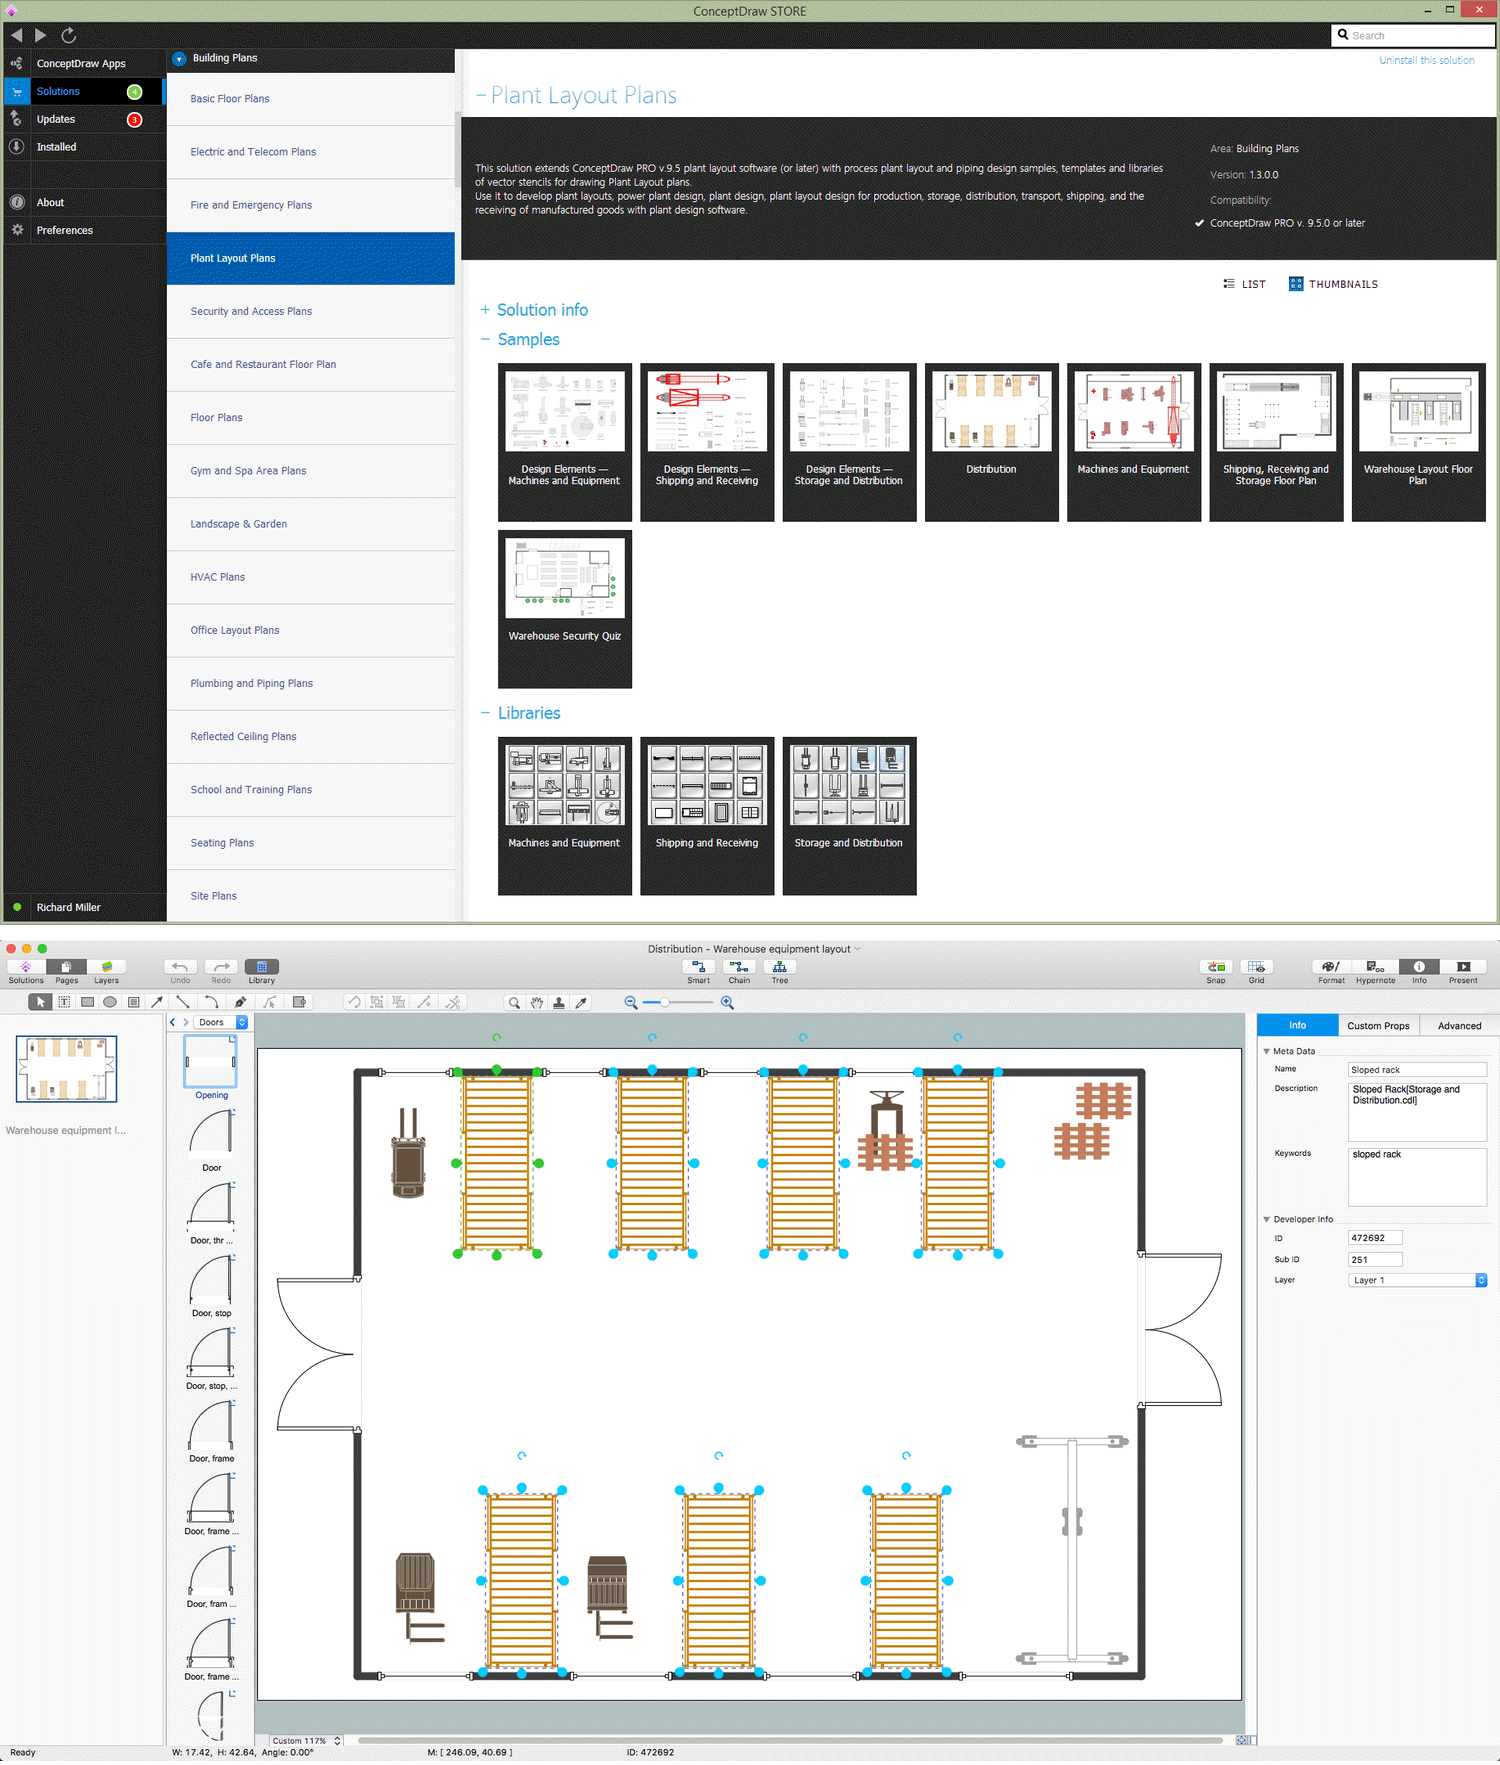
Picture: Storage Design Software
Related Solution:
The Cloud Computing Architecture is the structure of the system, which is based on the needs of end-user and includes the set of components and subcomponents required for cloud computing, among them cloud resources, services, middleware, software components, front-end platforms (cloud clients), cloud-based back end platforms (servers, storage), and a network (Internet, Intranet, Intercloud). When designing the Cloud Computing Architecture diagrams, the ConceptDraw DIAGRAM diagramming and vector drawing software advises to turn attention for the powerful Cloud Computing Diagrams solution from the extensive Computers and Network area of ConceptDraw Solution Park.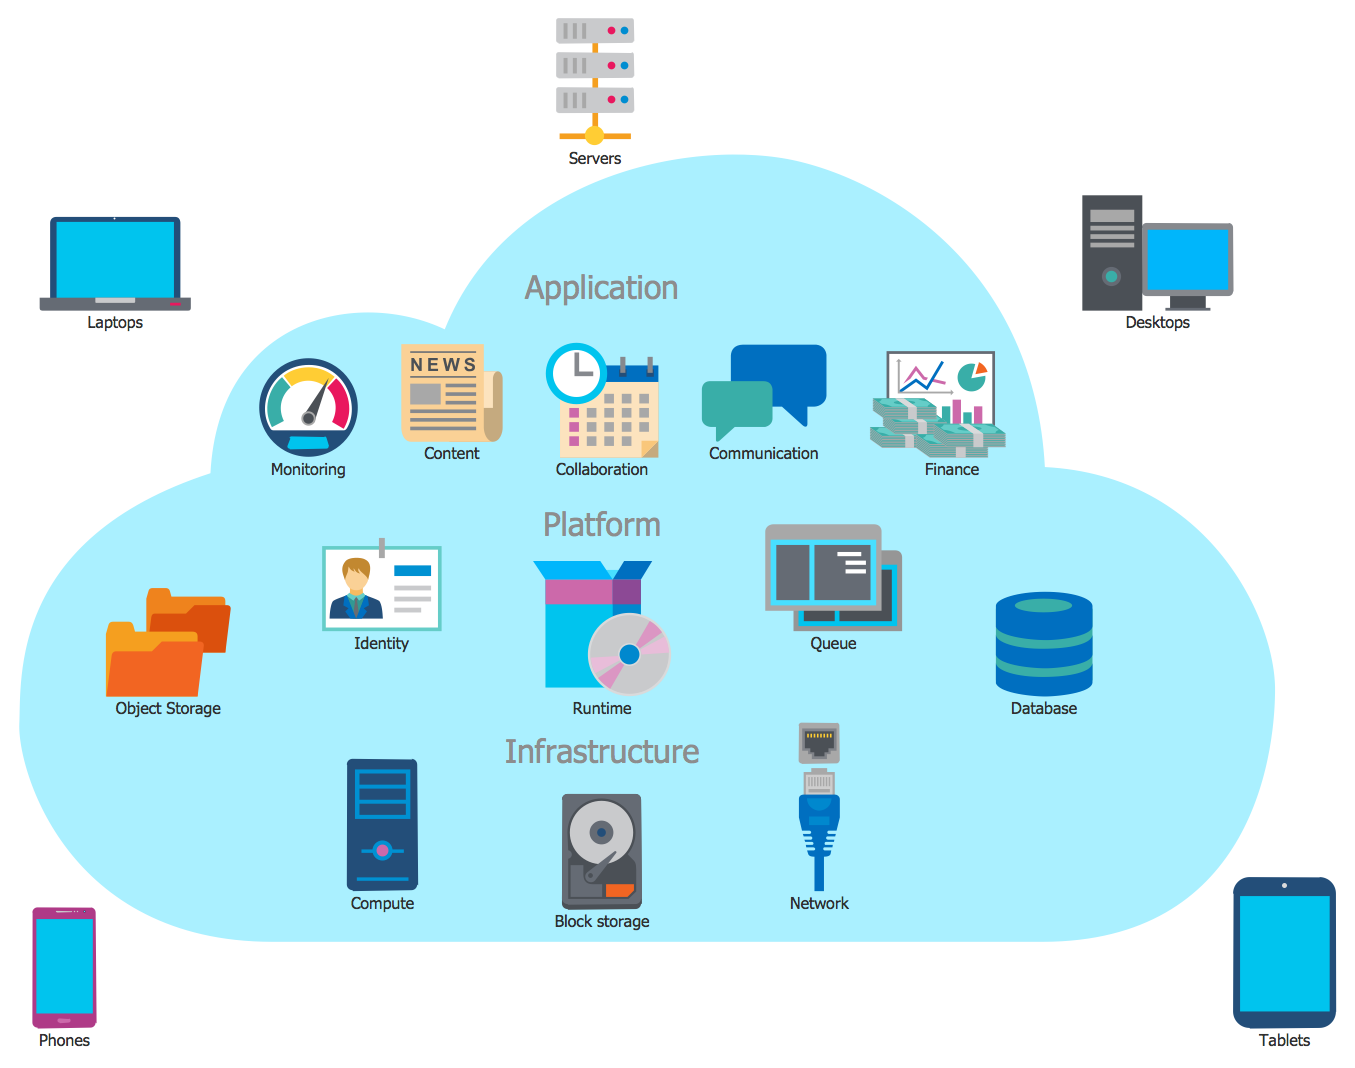
Picture: Cloud Computing Architecture
Related Solution:
ConceptDraw DIAGRAM is perfect for software designers and software developers who need to draw Cisco Network Diagrams.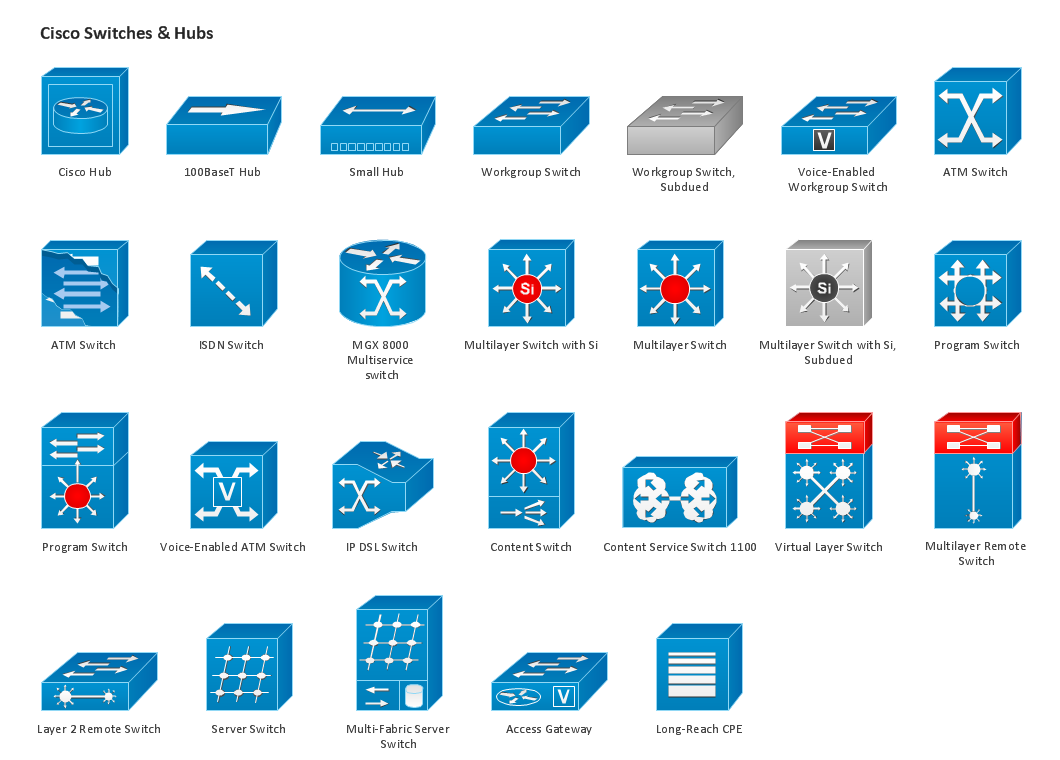
Picture: Design Element: Cisco for Network Diagrams
The ConceptDraw vector stencils library Cisco WAN contains equipment symbols for drawing the computer wide area network diagrams.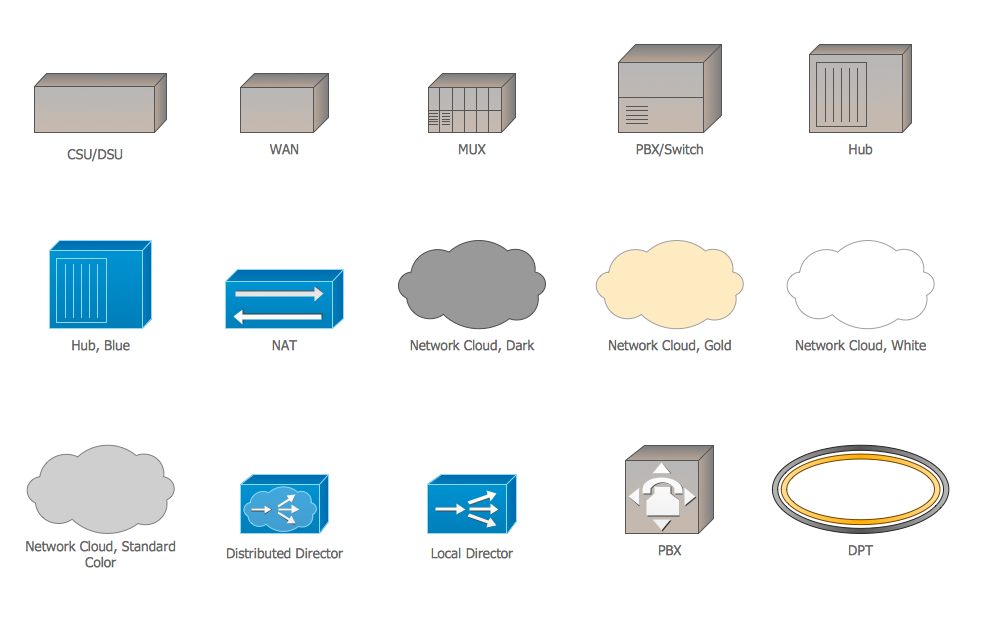
Picture: Cisco WAN. Cisco icons, shapes, stencils and symbols
Related Solution:
The Cisco Network Diagrams solution from the Computer and Networks area of ConceptDraw Solution Park provides a wide collection of predesigned templates and samples that help you to create the Cisco Network Diagrams in one moment.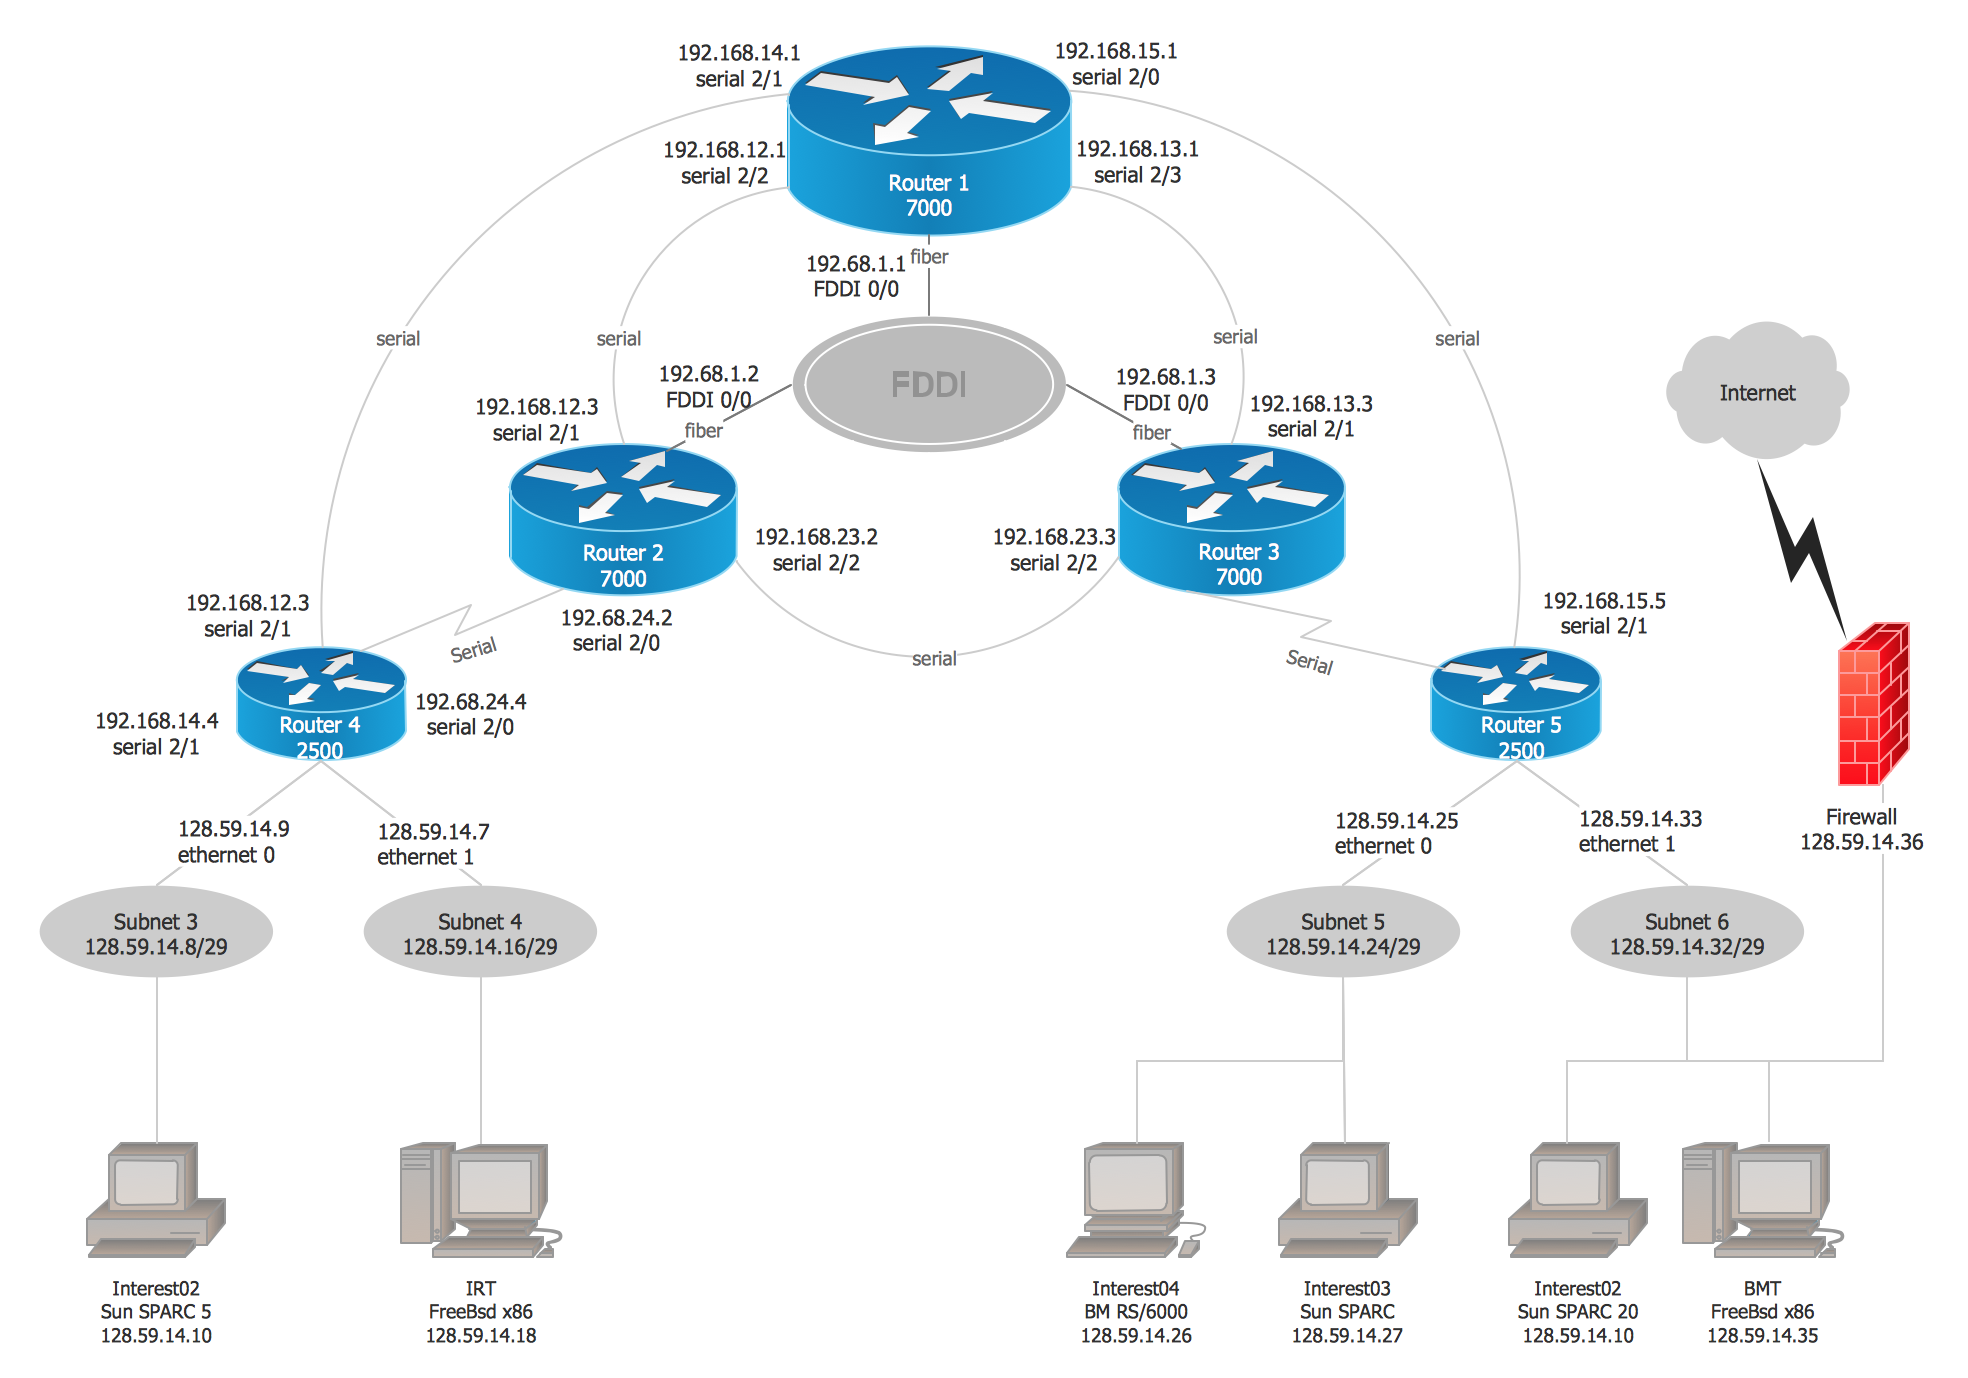
Picture: Cisco Network Examples and Templates
Related Solution:
Gantt Chart Templates - PM Easy Solution from the Project Management Area extends ConceptDraw PROJECT with the ability to quickly start a project. It lists task dependencies and relationships making the terative planning easy.
ConceptDraw PROJECT lets you the useful possibility to create visual project dashboards and diagrams, generate various kinds of reports with one click. It provides also extensive capabilities of importing and exporting in various formats: Microsoft Project, ConceptDraw MINDMAP , Mindjet MindManager, PDF file.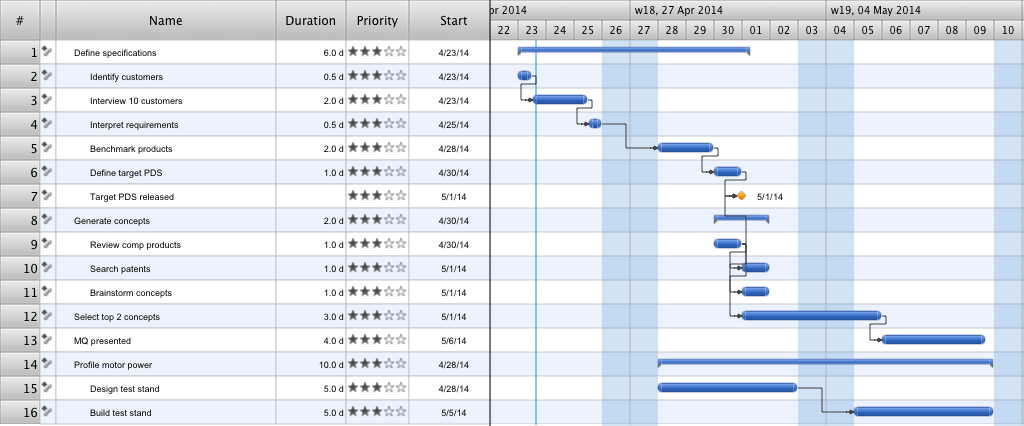
Picture: Gantt Chart Templates