"Problem-solving consists of using generic or ad hoc methods, in an orderly manner, for finding solutions to problems. Some of the problem-solving techniques developed and used in artificial intelligence, computer science, engineering, mathematics, medicine, etc. are related to mental problem-solving techniques studied in psychology." [Problem solving. Wikipedia]
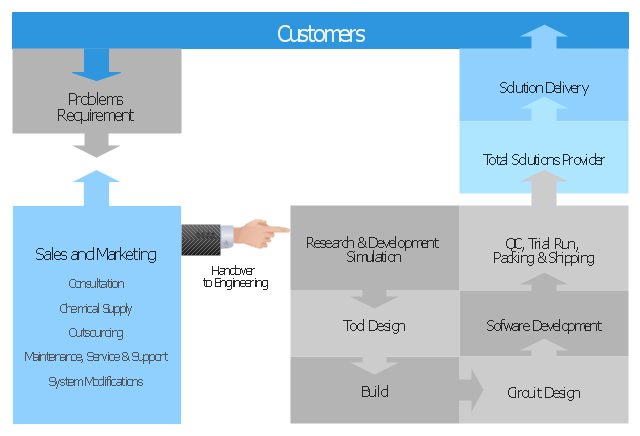
The block diagram example "Total solution process" was created using the ConceptDraw PRO diagramming and vector drawing software extended with the Block Diagrams solution from the area "What is a Diagram" of ConceptDraw Solution Park.
The block diagram example "Total solution process" was created using the ConceptDraw PRO diagramming and vector drawing software extended with the Block Diagrams solution from the area "What is a Diagram" of ConceptDraw Solution Park.
Block diagram
 Total Quality Management TQM Diagrams
Total Quality Management Diagrams solution extends ConceptDraw PRO software with samples, templates and vector stencils library for drawing the TQM flowcharts.
 Block Diagrams
Block diagrams solution extends ConceptDraw PRO software with templates, samples and libraries of vector stencils for drawing the block diagrams.
 Cross-Functional Flowcharts
Cross-functional flowcharts are powerful and useful tool for visualizing and analyzing complex business processes which requires involvement of multiple people, teams or even departments. They let clearly represent a sequence of the process steps, the order of operations, relationships between processes and responsible functional units (such as departments or positions).
TQM Diagram Example

 Event-driven Process Chain Diagrams
Event-driven Process Chain (EPC) Diagram is a type of flowchart widely used for modeling in business engineering and reengineering, business process improvement, and analysis. EPC method was developed within the Architecture of Integrated Information Systems (ARIS) framework.
 ConceptDraw Solution Park
ConceptDraw Solution Park collects graphic extensions, examples and learning materials
 Business Process Diagrams
The Business Process Diagram Solution extends ConceptDraw PRO v10 BPMN software with its RapidDraw interface, templates, samples, and libraries based on the BPMN 1.2 and BPMN 2.0 standards. This powerful solution permits you to visualize easily both simple and complex processes, as well as design business models. The Business Process Diagram solution allows one to quickly develop and document in detail any business processes at any stage of a project’s planning and implementation.
 Workflow Diagrams
Workflow Diagrams solution extends ConceptDraw PRO software with samples, templates and vector stencils library for drawing the work process flowcharts.
A Study of the Business Value of Total Quality Management

Best Vector Drawing Application for Mac OS X

 Flowcharts
The Flowcharts Solution for ConceptDraw PRO v10 is a comprehensive set of examples and samples in several different color themes for professionals that need to graphically represent a process. Solution value is added by basic flow chart template and shapes' library of Flowchart notation. ConceptDraw PRO flow chart creator lets one depict a processes of any complexity and length, as well design of the flowchart either vertically or horizontally.
Definition TQM Diagram

 Chemical and Process Engineering
This chemical engineering solution extends ConceptDraw PRO v.9.5 (or later) with process flow diagram symbols, samples, process diagrams templates and libraries of design elements for creating process and instrumentation diagrams, block flow diagrams (BFD
 Fishbone Diagram
Fishbone Diagrams solution extends ConceptDraw PRO software with templates, samples and library of vector stencils for drawing the Ishikawa diagrams for cause and effect analysis.
"The Process Flow Chart provides a visual representation of the steps in a process. ...
When to Use:
One of the first activities of a process improvement effort is constructing a flowchart. It provides the following benefits:
1- It give you and everyone a clear understanding of the process.
2- Facilitates teamwork and communication.
3- Helps to identify non-value-added operations."
[bexcellence.org/ Flow-Chart.html]
This TQM diagram example shows a business process that can be then analyzed to improve the effectiveness and diagnose quality issues that require resolution.
This example was created using the ConceptDraw PRO diagramming and vector drawing software extended with the Total Quality Management (TQM) Diagrams solution from the Quality area of ConceptDraw Solution Park.
TQM diagram

 Audit Flowcharts
Audit flowcharts solution extends ConceptDraw PRO software with templates, samples and library of vector stencils for drawing the audit and fiscal flow charts.
Identifying Quality Management System

 Accounting Flowcharts
Accounting Flowcharts solution extends ConceptDraw PRO software with templates, samples and library of vector stencils for drawing the accounting flow charts.
- Total Quality Management TQM Diagrams | TQM Diagram Example ...
- Total Quality Management TQM Diagrams | Block diagram - Total ...
- Engineering | Process Flowchart | Total Quality Management TQM ...
- Cross-Functional Flowcharts | TQM Software Build Professional ...
- Block Diagrams | IDEF0 standard with ConceptDraw PRO | Block ...
- Cross Functional Flowchart Examples | Fishbone Diagram | TQM ...
- Flowchart Example : Flow Chart of Marketing Analysis
- TQM Diagram Example | Total Quality Management TQM Diagrams ...
- Total Quality Management TQM Diagrams | TQM Diagram Tool ...
- Seven Management and Planning Tools | Flowchart Process ...
- Fishbone diagram - Production process | Total Quality Management ...
- Quality Area | Lean Manufacturing Diagrams | TQM Diagram Tool ...
- TQM Diagram Professional Total Quality Management | Good ...
- Affinity diagram - Implementing continuous process improvement ...
- Cause and Effect Analysis (Fishbone Diagrams ) | TQM Diagram ...
- TQM Diagram Example | TQM diagram example | Total Quality
- Process Flowchart
- Probability Quality Control Tools | TQM Diagram Example | TQM ...
- Accounting Flowcharts | Account Flowchart . Flowchart Examples ...
- Business Process Management | Business Process Diagram | Event ...