Soccer (Football) Formation
 Formation *")
Baseball Diagram – Baseball Field – Corner View – Template

Venn Diagram Examples for Problem Solving. Computer Science. Chomsky Hierarchy

 Timeline Diagrams
Timeline Diagrams solution extends ConceptDraw DIAGRAM diagramming software with samples, templates and libraries of specially developed smart vector design elements of timeline bars, time intervals, milestones, events, today marker, legend, and many other elements with custom properties, helpful for professional drawing clear and intuitive Timeline Diagrams. Use it to design simple Timeline Diagrams and designate only the main project stages, or highly detailed Timeline Diagrams depicting all project tasks, subtasks, milestones, deadlines, responsible persons and other description information, ideal for applying in presentations, reports, education materials, and other documentation.
Building Drawing Software for Design Seating Plan


3D Network Diagrams. Computer and Network Examples


Electrical Symbols, Electrical Diagram Symbols

Venn Diagram Examples for Problem Solving. Computer Science. Chomsky Hierarchy
Football – 2014 FIFA World Cup Standings Group

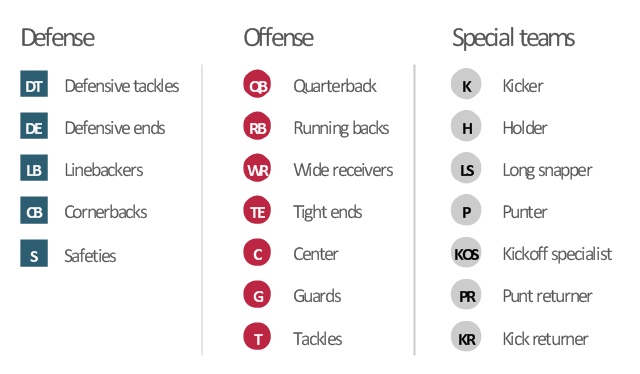
The vector stencils library "American football positions" contains 38 symbols for drawing diagrams of American football positions.
"A football game is played between two teams of 11 players each. It is legal to have fewer players on the field, but playing with more on the field is punishable by a penalty. Teams may substitute any number of their players between downs; this "platoon" system replaced the original system, which featured limited substitution rules, and has resulted in teams utilizing specialized offensive, defensive and special teams squads.
Individual players in a football game must be designated with a uniform number between 1 and 99. NFL teams are required to number their players by a league-approved numbering system, and any exceptions must be approved by the Commissioner. NCAA and NFHS teams are "strongly advised" to number their offensive players according to a league-suggested numbering scheme." [American football. Wikipedia]
The symbols example "Design elements - Football positions" was created using the ConceptDraw PRO diagramming and vector drawing software extended with the Football solution from the Sport area of ConceptDraw Solution Park.
American football positions diagram symbols
ERD Symbols and Meanings


 Sport Field Plans
Sport Field Plans solution extends ConceptDraw DIAGRAM with samples, templates and libraries of ready-made design elements for developing layouts of sport fields, recreation areas, playground layouts plans, and for professional drawing various sport field plans — for football, basketball, volleyball, golf, baseball, tennis, etc. Depict all your playground layout ideas easily and decisively implement the playground layout designs. Use the final colorful, strict and accurate ConceptDraw's playground layouts when designing the building documentation, brochures, booklets, advertising materials, sports editions, sport maps, business plans, on web sites of sport complexes, sport centers, hotels, etc.
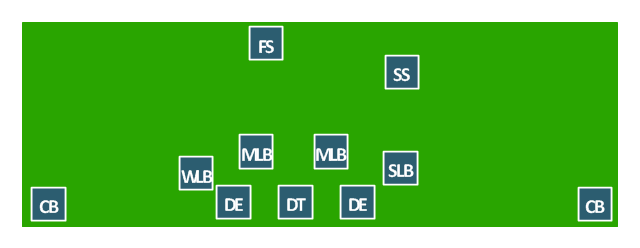
"In American football, each team has eleven players on the field at one time. The specific role that a player takes on the field is called their position. Under the modern rules of American football, teams are allowed unlimited substitutions, that is teams may change any number of players after any play. This has resulted in the development of three "platoons" of players, the offense (the team with the ball, who is trying to score), the defense (the team trying to prevent the other team from scoring, and to take the ball from them), and the special teams (who play in kicking situations). Within those platoons, various specific positions exist depending on what the player's main job is." [American football positions. Wikipedia]
The American football positions diagram example "3-4 Defense" was created using the ConceptDraw PRO diagramming and vector drawing software extended with the Football solution from the Sport area of ConceptDraw Solution Park.
The American football positions diagram example "3-4 Defense" was created using the ConceptDraw PRO diagramming and vector drawing software extended with the Football solution from the Sport area of ConceptDraw Solution Park.
American football positions diagram
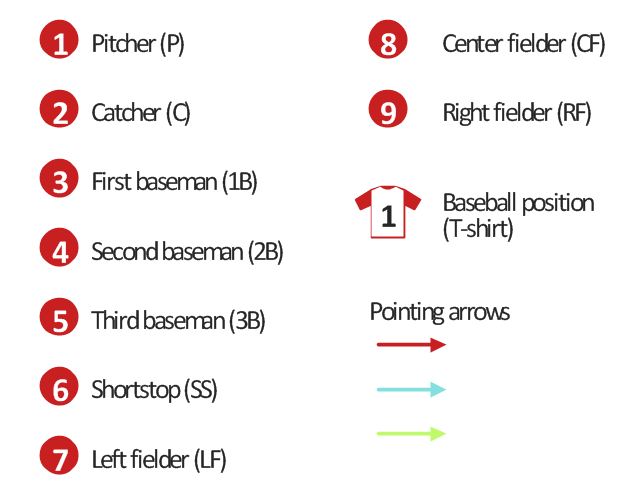
The vector stencils library "Baseball positions" contains 13 symbols: pitcher, catcher, first baseman, second baseman, third baseman, shortstop, left fielder, center fielder, right fielder, baseball position, pointing arrows.
"Baseball is unlike most other competitive sports in that the defense is given control of the ball. Additionally, the number of players on the field at any given time is lopsided in favor of the defense which always has nine players on the field; the offense has between one and four. ...
Each play starts with the ball in the hands of the pitcher, whose job as a member of the defense is to use his skills to somehow prevent the batter from reaching base. The pitcher throws the ball toward the catcher, whose must catch the pitched ball if it is not hit by the batter. In each half-inning, the defense attempts to force three outs.
There are three basic ways in which an out can occur: 1.) If three strikes are recorded against the batter, 2.) if a ball hit by a batter is caught by a defensive player before it hits the ground, or 3.) if a runner who is between bases or has not reached a base to which he is forced is put out by a defensive player in possession of the ball.
If the batter manages to hit the ball, all nine defensive players become active and use the ball in attempting to prevent the batter from reaching base and runners already on base from advancing or scoring. while the offense is busy attempting to move runners around the baseball diamond toward home plate, the defense uses the ball in various ways to achieve outs.
If the defense forces three outs, their team is moved into the offensive role. The exception is if it is the ninth or an extra inning and they are ahead, in which case, the game ends and the defensive team wins." [Defense (sports). Wikipedia]
The symbols example "Design elements - Baseball positions" was created using the ConceptDraw PRO diagramming and vector drawing software extended with the Baseball solution from the Sport area of ConceptDraw Solution Park.
Baseball positions diagram symbols
 CRM Center Dashboard
The CRM Center Dashboard solution extends ConceptDraw DIAGRAM functionality with CRM software tools, large collection of CRM Charts live objects, CRM icons, CRM indicators, CRM maps and navigation elements, the set of professionally designed CRM samples and templates to help you construct your own CRM Dashboards and CRM Center Dashboards in a few minutes, to depict the current and actual data by connecting or refreshing the data source file. The customer management software ConceptDraw DIAGRAM makes you free to choose the style for your dashboard and to regulate the quantity of clipart on the diagram according to your taste.
How to Create a Scatter Chart

Internal Medicine

Building Drawing Software for Design Sport Fields

Baseball Diagram — Baseball Field — Corner View — Sample

Soccer (Football) Positions
 Positions *")
- Soccer (Football) Positions | Soccer (Football) Formation | Offensive ...
- Images Of A Football Field Numbers With Their Positions Of Players
- Soccer (Football) Formation | Design a Soccer (Football) Field ...
- Soccer (Football) Positions | Defensive Strategy Diagram – 46 ...
- Diagram Illustration Of Football Pitch And Wings Number
- Soccer (Football) Positions | Soccer (Football) Formation | Offensive ...
- Offensive Play – Double Wing Wedge – Vector Graphic Diagram ...
- Soccer (Football) Positions | Soccer (Football) Formation | Create ...
- Offensive Play – Double Wing Wedge – Vector Graphic Diagram ...
- Soccer (Football) Formation | Soccer (Football) Positions | Defensive ...
- Full Draw Of Football Field And Players Positions With Number
- Soccer (Football) Positions
- Design elements - Football positions | Association football (soccer ...
- Formation Of Football Players Number And Wings Diagram
- Design elements - Football positions
- Soccer (Football) Formation | Soccer (Football) Positions | Soccer ...
- Create Sophisticated Professional Diagrams - Simply | Association ...
- Association football (soccer) field dimensions | Demarcation Of ...
- How Football Players Are Arranged In The Field In Numbers
- Football Pitch Label With The Numbers