Project —Task Trees and Dependencies

ConceptDraw PROJECT Project Management Software Tool

CORRECTIVE ACTIONS PLANNING. PERT Chart


Product Overview

Communication Tool for Remote Project Management

Business diagrams & Org Charts with ConceptDraw DIAGRAM


 PM Planning
The PM Planning solution extends the functional abilities of ConceptDraw MINDMAP and ConceptDraw PROJECT software, allowing to automatically create the spreadsheets reflecting the tasks and project statuses for people who have different project roles. The reporting capabilities of this solution are represented by the possibility to generate a wide range of project reports that allow the project managers, senior management and other project participants to be informed on a project daily progress and monthly objectives: All Inclusive Report, All Visible Columns, Milestones with Notes and Objectives, Projects Goals, Projects Managers, Project Team, and Top Level Tasks. The PM Planning solution from ConceptDraw Solution Park is a strong project management and productivity tool which simplifies the process of reporting and lets one create a document with the desired report, includes the predesigned examples, extends and improves the planning capabilities for all team members, improves the project communication, helps to accurately plan, maintain, and finish projects on time, to track the work of project resources, to perform the analytical work and to make effective decisions.
Social Media Response Management DFD Charts - software tools


Management Tools — Total Quality Management

TQM Diagram Tool

Collaboration in a Project Team

 PM Easy
PM Easy solution extends the ConceptDraw PROJECT functionality with an ability to support neutral methodology of project management and to quickly start a project by listing the task relationships and dependencies, that makes the iterative planning much easier. The project management tool and available visual tools, such as mind mapping, increase the effectiveness of tracking and analysis your project tasks. PM Easy solution from ConceptDraw Solution Park is mainly targeted at project managers in small or medium-sized companies, allowing them to make the project plan and execute projects using mind mapping technique, to implement planning using mind mapping, and to track tasks using ConceptDraw PROJECT application.
 Project Management Area
Project Management area provides Toolbox solutions to support solving issues related to planning, tracking, milestones, events, resource usage, and other typical project management functions.
The PERT chart shows the logical connections and consequence of a set of tasks. PERT charts the time period for problem solving and the implementation plan for all activities along the critical path. The PERT chart is also known as a precedence diagram or project network diagram.
"The Program (or Project) Evaluation and Review Technique, commonly abbreviated PERT, is a statistical tool, used in project management, that is designed to analyze and represent the tasks involved in completing a given project. ...
PERT is a method to analyze the involved tasks in completing a given project, especially the time needed to complete each task, and to identify the minimum time needed to complete the total project.
PERT was developed primarily to simplify the planning and scheduling of large and complex projects. ...
A network diagram can be created by hand or by using diagram software. There are two types of network diagrams, activity on arrow (AOA) and activity on node (AON). Activity on node diagrams are generally easier to create and interpret." [Program Evaluation and Review Technique. Wikipedia]
The PERT chart is one of the Seven Management and Planning Tools (7 MP tools, Seven New Quality Tools).
The PERT chart template for the ConceptDraw PRO diagramming and vector drawing software is included in the solution "Seven Management and Planning Tools" from the Management area of ConceptDraw Solution Park.
PERT chart template

Legend

Software development with ConceptDraw products

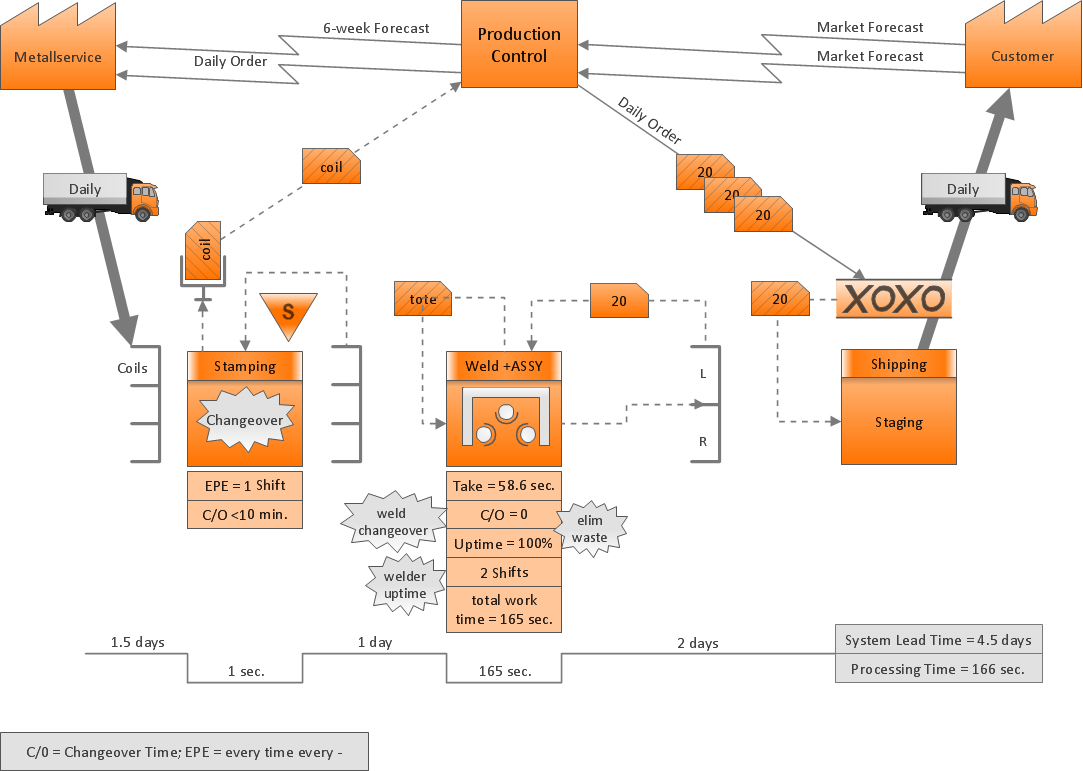
Purposes of a Value Stream Management Tool
CORRECTIVE ACTIONS PLANNING. Risk Diagram (PDPC)

- Project management task status dashboard
- PM Planning | Project Assigning Resources | Project ...
- What is Gantt Chart
- PM Presentations | Communication Tool for Remote Project ...
- Radial Tasks Diagram
- PM Easy | How to Report Task's Execution with Gantt Chart ...
- How To Hold Project Collaboration via Skype | One formula of ...
- PM Planning | Status Dashboard | Project tasks dashboard |
- How To Create Project Report | Product Overview | Project tasks ...
- Project management task status dashboard
- Communication Tool for Remote Project Management
- PM Easy | PM Personal Time Management | PM Planning |
- PM Dashboards | Project Management Area | Project tasks dashboard
- PERT chart - Project management plan | Program Evaluation and ...
- Activity Network (PERT) Chart | ConceptDraw PRO Network ...
- How To Create Project Report | How to Report Task's Execution with ...
- Seven Management and Planning Tools | Design elements ...
- Product Overview | Project tasks dashboard | Project Assigning ...
- Management | Seven Management and Planning Tools | PM ...
- How to Draw an Organization Chart | Seven Management and ...