Basic Diagramming
Create flowcharts, organizational charts, bar charts, line graphs, and more with ConceptDraw DIAGRAM.
Table Seating Chart Template
The arrangement of tables and seating charts near them have great value in many premises and situations. It is often very convenient to draw a plan before the furniture arrangement. ConceptDraw DIAGRAM software offers the Seating Plans solution from the Building Plans area for fast and easy drawing the table seating chart template and samples.Software Flow Chart
Many professionals have to solve problems every day. Designing of the process algorithm contribute to understand where the problem is in the process. A Flowchart is a graphical tool that most usable for breaking down processes. Definition of flowchart - a diagram that shows step-by-step progression through a procedure or system especially using connecting lines and a set of conventional symbols. All the icons, symbols and connectors needed for creating standardized notation flowcharts are contained within Software Flow Chart.
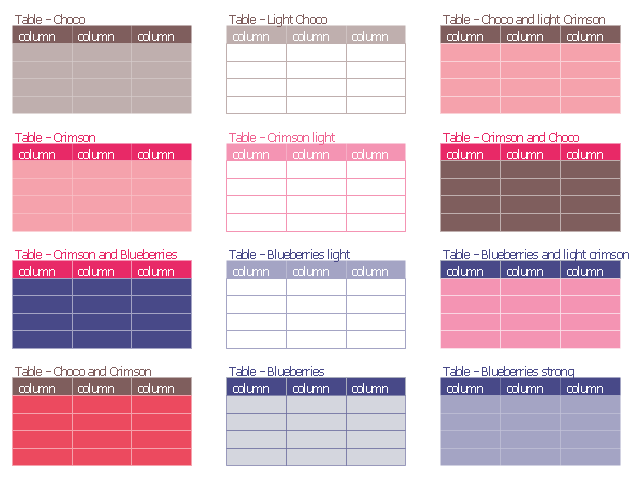
The vector stencils library "Tables" contains 12 table blocks. Use it to add typography elements into your infographics.
"A table is a means of arranging data in rows and columns. The use of tables is pervasive throughout all communication, research and data analysis. Tables appear in print media, handwritten notes, computer software, architectural ornamentation, traffic signs and many other places. The precise conventions and terminology for describing tables varies depending on the context. Further, tables differ significantly in variety, structure, flexibility, notation, representation and use. In books and technical articles, tables are typically presented apart from the main text in numbered and captioned floating blocks." [Table (information). Wikipedia]
The example "Design elements - Tables" was created using the ConceptDraw PRO diagramming and vector drawing software extended with the Typography Infographics solition from the area "What is infographics" in ConceptDraw Solution Park.
Feature Comparison Chart Software
An example of marketing analysis diagram, can be used to analyse product market and define marketing strategy. This sample shows the Feature Comparison Chart of the digital scouting cameras. It can be useful for digital cameras production field, marketing, sales, etc.Pie Chart
ConceptDraw DIAGRAM diagramming and vector drawing software offers the Pie Charts solution from the Graphs and Charts area of ConceptDraw Solution Park for quick and easy drawing the Pie Chart of any complexity.Symbol for Pool Table for Floor Plans
Below you can see the symbol for pool table. You can find this symbol in the library of the Floor Plans Solution and use it in your floor plan of the sport complex, home, etc. ConceptDraw DIAGRAM is a powerful diagramming and vector drawing software for creating the different Floor Plans. It’s very convenient, simple and quick to design the professional looking Floor Plans of any difficulty in ConceptDraw DIAGRAM.PERT Chart Software
PERT Chart Software - Activity Network and Project Evaluation and Review Technique, or PERT, charts are a way of documenting and analyzing the tasks in a project. ConceptDraw DIAGRAM is a powerful diagramming and vector drawing software for designing professional looking PERT Charts quick and easy.Building Drawing Software for Design Seating Plan
A Seating Plan is a scheme that illustrates the arrangement of seats on the plan of specific place. The seats can be located separately or grouped in rows like in stadiums. Usually they are numerated allowing spectators to choose them beforehand and have a guaranteed seat. It is especially useful for cinemas and theaters, where the places differ according to their price range. When all seatings are equal, it is used the open seating scheme and each client can choose any free seat. Each of these seating systems has many own advantages, it is also possible to mix them. Seating Plans, Schemes and Drawings are popular and widely used for purchase and sale the entering tickets to theatres, cinemas, stadiums, trains, airplanes, etc. They are also useful for beforehand planning and assignment the seats on weddings, banquets, and other events. ConceptDraw DIAGRAM enhanced with Seating Plans solution offers the helpful building drawing software tools for design Seating Plan using the predesigned templates and vector elements of doors, windows, walls, seats, etc.
Relative Value Chart Software
Relative value is a value measured in the terms of liquidity, risks, return of one investment or financial instrument relative to another. Relative values are widely used in:business, economics, investment, management, marketing, statistics, etc. ConceptDraw DIAGRAM software is the best for drawing professional looking Relative Value Charts. ConceptDraw DIAGRAM provides Divided Bar Diagrams solution from the Graphs and Charts Area of ConceptDraw Solution Park.Business Report Pie. Pie Chart Examples
This sample shows the Business Report Pie Chart. The Pie Chart visualizes the data as the proportional parts of a whole, illustrates the numerical proportion. Pie Charts are very useful in the business, statistics, analytics, mass media.Scatter Graph
You've got to draw the Scatter Graph and look for the convenient tool which will help you? Direct your attention on the ConceptDraw DIAGRAM diagramming and vector drawing software extended with Scatter Diagrams Solution from the Graphs and Charts Area.Donut Chart Templates
These donut chart templates was designed using ConceptDraw DIAGRAM diagramming and vector drawing software extended with Pie Charts solution from Graphs and Charts area of ConceptDraw Solution Park. All these donut chart templates are included in the Pie Charts solution. You can quickly rework these examples into your own charts by simply changing displayed data, title and legend texts.Vertical Cross Functional Flowchart
ConceptDraw DIAGRAM is a powerful tool that helps you create professional looking cross-functional flowcharts with the well-designed objects. ConceptDraw DIAGRAM - Drawing Software for Vertical Cross Functional Flowchart. ConceptDraw allows you to focus on work, not the drawing process. ConceptDraw Arrows10 Technology allows to draw connectors with smart behavior that gives flexibility to you during work process.Spider Chart Template
This sample shows the Spider Chart that represents the budget and spending for one organization and allows to compare them. The multivariate data are represented on the Spider Chart as a two-dimensional chart with four or more variables displayed on the axes that start in one point. The Spider Charts are used in the management, business and sport.Seating Chart Template Free
You need design the seating chart? The simple way is to use the specialized software. ConceptDraw DIAGRAM diagramming and vector drawing software extended with Seating Plans solution from the Building Plans area with powerful drawing tools, samples, seating chart template free will be ideal for you.Chemistry Drawing Software
ConceptDraw DIAGRAM extended with Chemistry solution from the Science and Education area is a powerful chemistry drawing software that provides the useful tools to help you design all kinds of chemistry drawings and illustrations, chemical schemes and diagrams of formulas, reaction schemes and lab set-ups of any complexity.Building Drawing Software for Design Office Layout Plan
The building plans and blueprints are useful for designing and construction various premises, including definitely offices, small and large office buildings, and whole business centers. Comfort and convenience are the most important for office premises, they let configure on a working mood and increase the work productivity, so the architects and designers need to consider carefully all details. Often their construction on the paper is painstaking and labourious process, which doubly faster and easier to realize with the availability of specialized software, such as ConceptDraw DIAGRAM. Design of simple and extensive detailed Office Layout Plans, effective allocation a working space are easily with ConceptDraw DIAGRAM powerful vector diagramming and building drawing software tools, and ready-to-use vector design objects. Use they to develop the Office floor plans, Office layout plans, Blueprints for office space planning and furniture placement, Office electrical plans, Office emergency plans, etc. Thought Visio is not available for Mac, there are Visio alternatives which support MS Visio file formats. Try ConceptDraw DIAGRAM for both PC and Mac platforms to see its perpetual license privilege.
How to Draw an Organizational Chart
An Organizational chart is a type of diagram which visually displays the structure of an organization, relationships and relative ranks of the organization′s parts and positions. Organizational chart is constructed as an hierarchical structure, in the form of tree. How to Draw an Organization Chart the most easy and quickly? The Organizational Charts solution, innovative Tree Auto-connection mode and ConceptDraw Arrows10 Technology included in ConceptDraw DIAGRAM software are powerful drawing tools that change the way of diagrams production. Arrows10 Technology provides smart behavior for the connectors, and so quick and precise placement when drawing, and lets easy make the changes and automatic rearrangement. It helps to make the process of drawing diagrams more efficient, easier and faster. Now, you don′t need to think on how to connect or place the objects, you can concentrate fully on what to draw. See obligatory the helpful video tutorial about creation the Organization Charts and orgchart professional presentations with ConceptDraw products.Marketing Flow Chart
ConceptDraw DIAGRAM diagramming and vector drawing software extended with Marketing Diagrams Solution from the Marketing Area of ConceptDraw Solution Park is the best software for quick and easy creating Marketing Flow Chart of any complexity and design. This charts created to define marketing project stages. In small business project management it sometimes generated by simple marketing project management software. Here is samples which included in Marketing Area of ConceptDraw Solution Park and it can be used as for project planning software as for project management report.- Chemistry Drawing Software | Chemistry Drawings | Chemistry ...
- Chemistry Drawing Software | Sketch The Periodic Table
- How to Draw Chemistry Structures | Chemistry Drawing Software
- Table Seating Chart Template | Building Drawing Software for ...
- How to Draw Chemistry Structures | Periodic Table Drawing On Chart
- Chemistry Drawing Software | Drawing Of Peripdic Table
- Design elements - Periodic table of chemical elements | Chemistry ...
- Building Drawing Software for Design Seating Plan | Interior Design ...
- Chemistry Drawing Software | Easy To Draw Periodic Table
- Chemistry Drawing Software | Draw A Standard Periodic Table
