Stakeholder Management System

 Stakeholder Onion Diagrams
The Stakeholder Onion Diagram is often used as a way to view the relationships of stakeholders to a project goal. A basic Onion Diagram contains a rich information. It shows significance of stakeholders that will have has influence to the success achieve
Stakeholder Onion Diagrams

Visualize Stakeholder Analysis

Stakeholder Mapping Tool

Stakeholder Onion Diagram Template

Onion Diagram Maker

How To Create Onion Diagram

Onion Diagram Templates

Onion Diagram Process Design

The vector stencils library "UML use case diagrams" contains 25 symbols for the ConceptDraw PRO diagramming and vector drawing software.
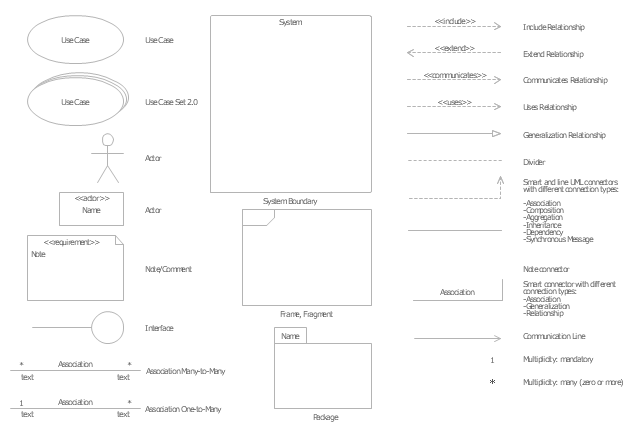
"Use case diagrams are usually referred to as behavior diagrams used to describe a set of actions (use cases) that some system or systems (subject) should or can perform in collaboration with one or more external users of the system (actors). Each use case should provide some observable and valuable result to the actors or other stakeholders of the system. ...
Use case diagrams are in fact twofold - they are both behavior diagrams, because they describe behavior of the system, and they are also structure diagrams - as a special case of class diagrams where classifiers are restricted to be either actors or use cases related to each other with associations. ...
Use case is usually shown as an ellipse containing the name of the use case. ...
Name of the use case could also be placed below the ellipse. ...
If a subject (or system boundary) is displayed, the use case ellipse is visually located inside the system boundary rectangle. Note, that this does not necessarily mean that the subject classifier owns the contained use cases, but merely that the use case applies to that classifier. ...
A list of use case properties - operations and attributes - could be shown in a compartment within the use case oval below the use case name. ...
Use case with extension points may be listed in a compartment of the use case with the heading extension points. ...
A use case can also be shown using the standard rectangle notation for classifiers with an ellipse icon in the upper right-hand corner of the rectangle and with optional separate list compartments for its features. ...
Subject (sometimes called a system boundary) is presented by a rectangle with subject's name, associated keywords and stereotypes in the upper left corner. Use cases applicable to the subject are located inside the rectangle and actors - outside of the system boundary. ...
Standard UML notation for actor is "stick man" icon with the name of the actor above or below of the icon. Actor names should follow the capitalization and punctuation guidelines for classes. The names of abstract actors should be shown in italics. ...
Custom icons that convey the kind of actor may also be used to denote an actor, such as using a separate icon(s) for non-human actors. ...
An actor may also be shown as a class rectangle with the standard keyword «actor», having usual notation for class compartments ...
An actor can only have binary associations to use cases, components, and classes. ...
An association between an actor and a use case indicates that the actor and the use case somehow interact or communicate with each other.
Only binary associations are allowed between actors and use cases.
An actor could be associated to one or several use cases. ...
A use case may have one or several associated actors." [uml-diagrams.org/ use-case-diagrams.html]
The example "Design elements - UML use case diagrams" is included in the Rapid UML solution from the Software Development area of ConceptDraw Solution Park.
UML use case diagram symbols
 SYSML
SYSML
The SysML solution helps to present diagrams using Systems Modeling Language; a perfect tool for system engineering.
Network Diagram Software. LAN Network Diagrams. Physical Office Network Diagrams


 Computer Network Diagrams
Computer Network Diagrams solution extends ConceptDraw DIAGRAM software with samples, templates and libraries of vector icons and objects of computer network devices and network components to help you create professional-looking Computer Network Diagrams, to plan simple home networks and complex computer network configurations for large buildings, to represent their schemes in a comprehensible graphical view, to document computer networks configurations, to depict the interactions between network's components, the used protocols and topologies, to represent physical and logical network structures, to compare visually different topologies and to depict their combinations, to represent in details the network structure with help of schemes, to study and analyze the network configurations, to communicate effectively to engineers, stakeholders and end-users, to track network working and troubleshoot, if necessary.
 Telecommunication Network Diagrams
Telecommunication Network Diagrams solution extends ConceptDraw DIAGRAM software with samples, templates, and great collection of vector stencils to help the specialists in a field of networks and telecommunications, as well as other users to create Computer systems networking and Telecommunication network diagrams for various fields, to organize the work of call centers, to design the GPRS networks and GPS navigational systems, mobile, satellite and hybrid communication networks, to construct the mobile TV networks and wireless broadband networks.
 Interactive Voice Response Diagrams
Interactive Voice Response Diagrams solution extends ConceptDraw DIAGRAM software with samples, templates and libraries of ready-to-use vector stencils that help create Interactive Voice Response (IVR) diagrams illustrating in details a work of interactive voice response system, the IVR system’s logical and physical structure, Voice-over-Internet Protocol (VoIP) diagrams, and Action VoIP diagrams with representing voice actions on them, to visualize how the computers interact with callers through voice recognition and dual-tone multi-frequency signaling (DTMF) keypad inputs.
- System Stakeholders Diagram
- Conceptdraw.com: Mind Map Software, Drawing Tools | Project ...
- Stakeholder Management System
- Stakeholder Onion Diagrams
- Visualize Stakeholder Analysis | Onion Diagram Maker ...
- Onion Diagram With 3 Sectors Template
- Stakeholder Onion Diagram Template
- Round Onion Diagram Template
- How To Create Onion Diagram | Stakeholder Onion Diagram ...
- Onion Diagram Process Design | Stakeholder Onion Diagrams ...
- Circular Arrows Diagrams | Target and Circular Diagrams | Circle ...
- UML Use Case Diagram Example Social Networking Sites Project ...
- Design elements - UML use case diagrams
- Element Of System
- Wireless Networks | Wireless Network Diagram Examples | Hotel ...
- Circular arrows diagram
- Entity-Relationship Diagram (ERD) | Stakeholder Onion Diagrams ...
- Diagram Of A Computer Network Pdf
- Design elements - UML use case diagrams | UML Diagram Types ...
- Diagramming Software for Design UML Use Case Diagrams | UML ...