Corrective Action Planning
One of the stages of the problem's solving process scenario is Corrective Action Planning. Corrective action planning define people and groups involvement in corrective actions by roles, identify logical sequences of scheduled actions and critical path of problem solving, identify possible risks of action plan and propose preventive actions.
Problem Analysis
ConceptDraw Office suite is a software for Problem Analysis. The Seven Management and Planning Tools are a set of such tools for investigating complex problems. These tools are exemplary at organizing research, parsing complex problems, providing a structure for the details, helping managers make decisions, and organizing effective communications in a visual manner that keeps everyone involved
HelpDesk
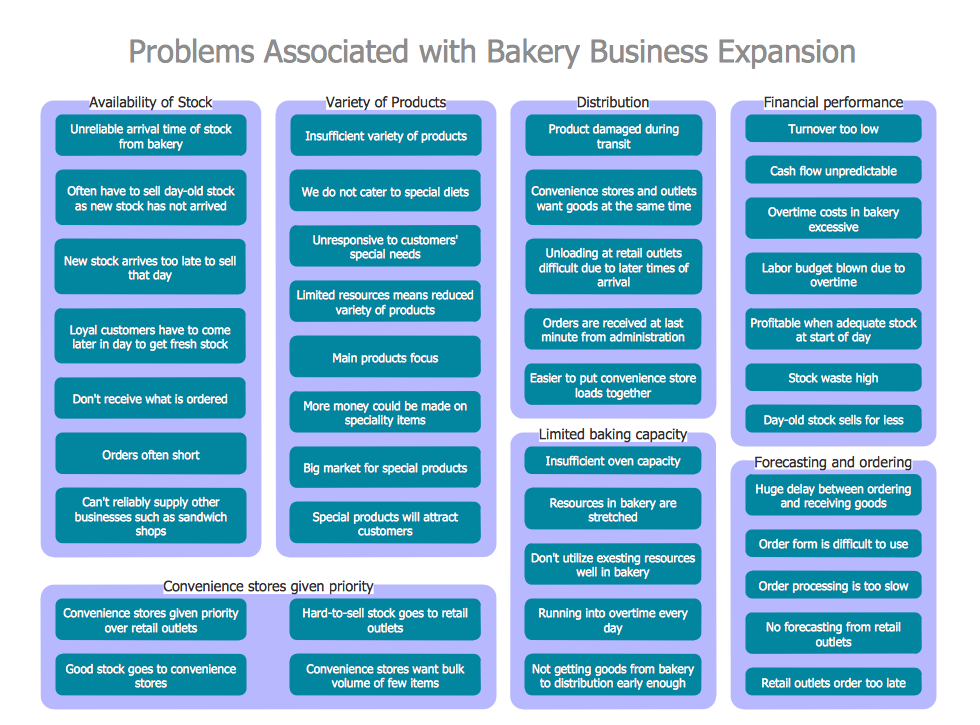
How to Manage Problem Solving Using Seven Management and Planning Tools
Stage by stage gouide on using visual tools to move toward solving the problem.
CORRECTIVE ACTIONS PLANNING. PERT Chart
The PERT Chart is constructed as part of the process in creating a schedule of corrective actions. The PERT Chart shows the logical connections and consequence of tasks to be performed. It displays the time period for problem solving and the implementation of all activities through the critical path. ConceptDraw Office suite is a software for corrective actions planning.
Emergency Action Plan Template
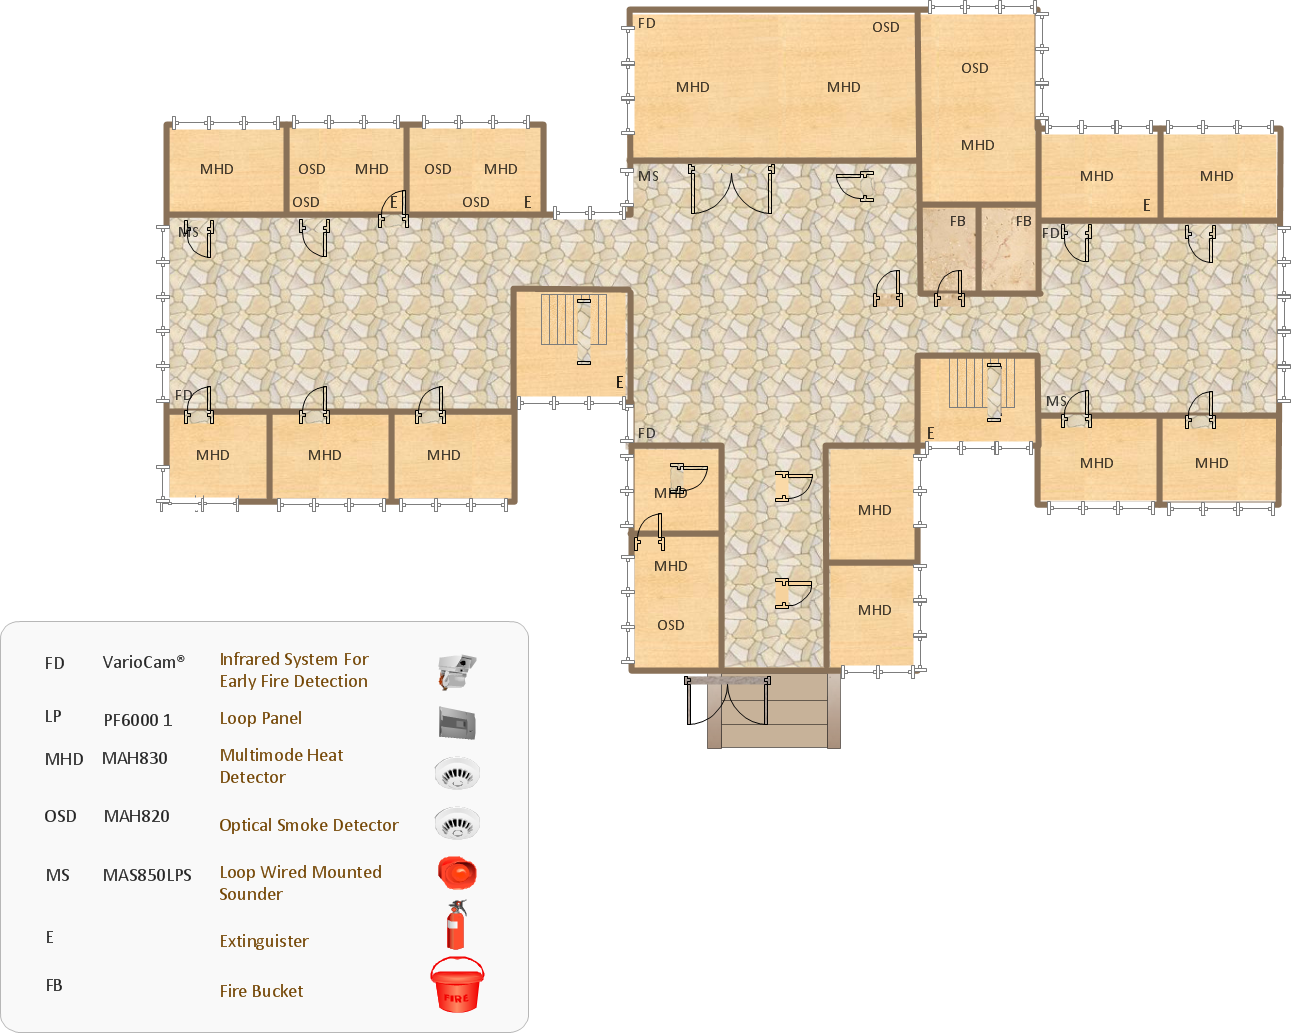
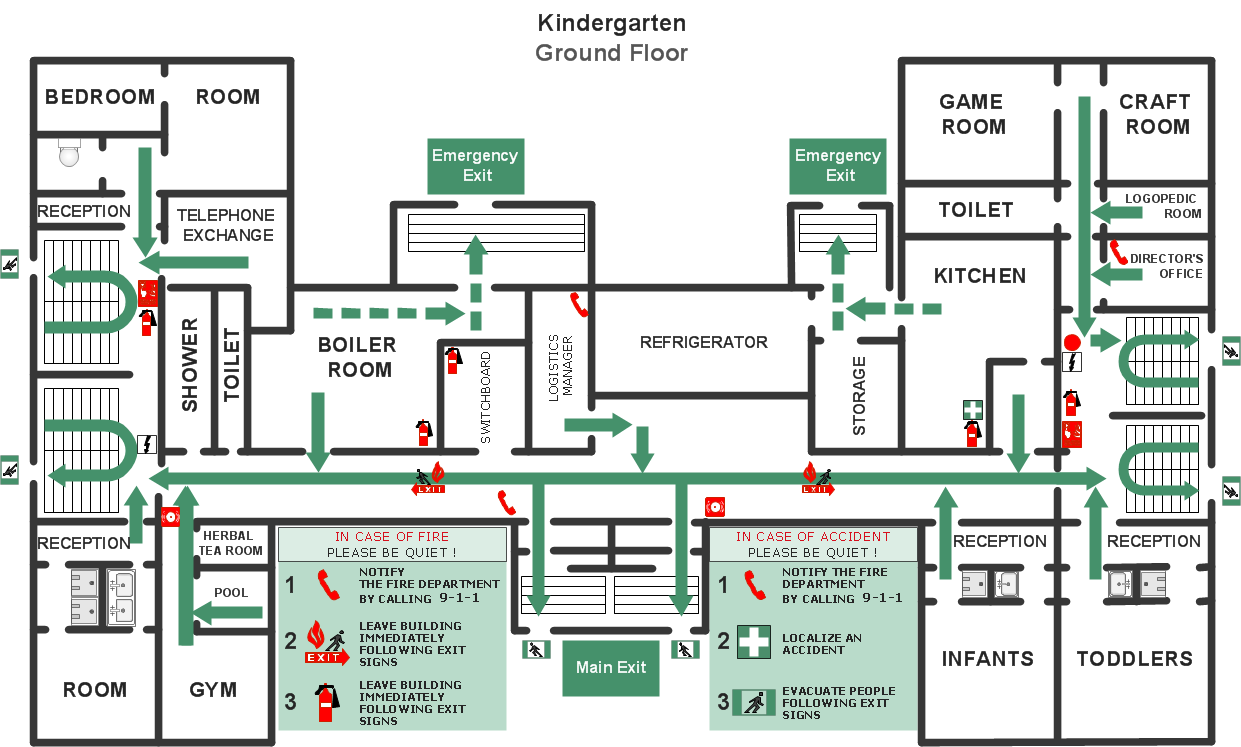
In the case of origin of an emergency is very important to have a correct, clear and comprehensible action plan which will help you to react quicker and to make right decisions. ConceptDraw DIAGRAM software extended with Fire and Emergency Plans solution from the Building Plans Area of ConceptDraw Solution Park provides extensive drawing tools for quick and easy creating fire and emergency plans, and also a set of various templates and samples, among them the Emergency Action Plan Template.7 Management & Planning Tools
The 7 Management and Planning Tools solution available from ConceptDraw Solution Park implements well-known methodologies and provides the comprehensive set of tools for problems' analysis and solving. Different products from multifunctional ConceptDraw Office suite may be used as a complete solution for any of methodologies offered by this solution and provide a visual communication during every stage of work. Use the MINDMAP 7 Management & Planning Tools for step-by-step identification and analysis the problems, for planning solving and corrective actions, and also countermeasures to address the risks. 7 Management and Planning Tools solution is perfect for managers in medium to large companies, who require effective tools to address the management issue, for business consultants, trainers and coaches to help visualize the problem's solving by using 7 MP Tools methodology, to structure the problem's affecting factors, analyze their root causes and cause and effect relations, to highlight drivers and indicators factors, to prioritize factors using ranking by criteria set.Flowchart Definition
Flowchart definition - A Flowchart is a diagram that graphically represents the structure of the system, the flow of steps in a process, algorithm, or the sequence of steps and decisions for execution a process or solution a problem. For depiction the steps there are used specific shapes and graphic symbols which are linked by lines and directional arrows. The main standard shapes are rectangle or box, rounded box, diamond, circle. A Flowchart is a convenient way to observe the follow the process from beginning to end, it lets improve the work of process, highlight the key elements and detach not essential or even excessive steps. The Flowcharts can represent different levels of detail: High-Level Flowchart, Detailed Flowchart, and Deployment or Matrix Flowchart. They are incredibly useful for programmers when developing the programs of any complexity and on any high level language. Create your own Flowcharts using the ConceptDraw DIAGRAM diagramming and vector drawing software and powerful tools of Flowcharts solution from "Diagrams" area.PROBLEM ANALYSIS. Prioritization Matrix
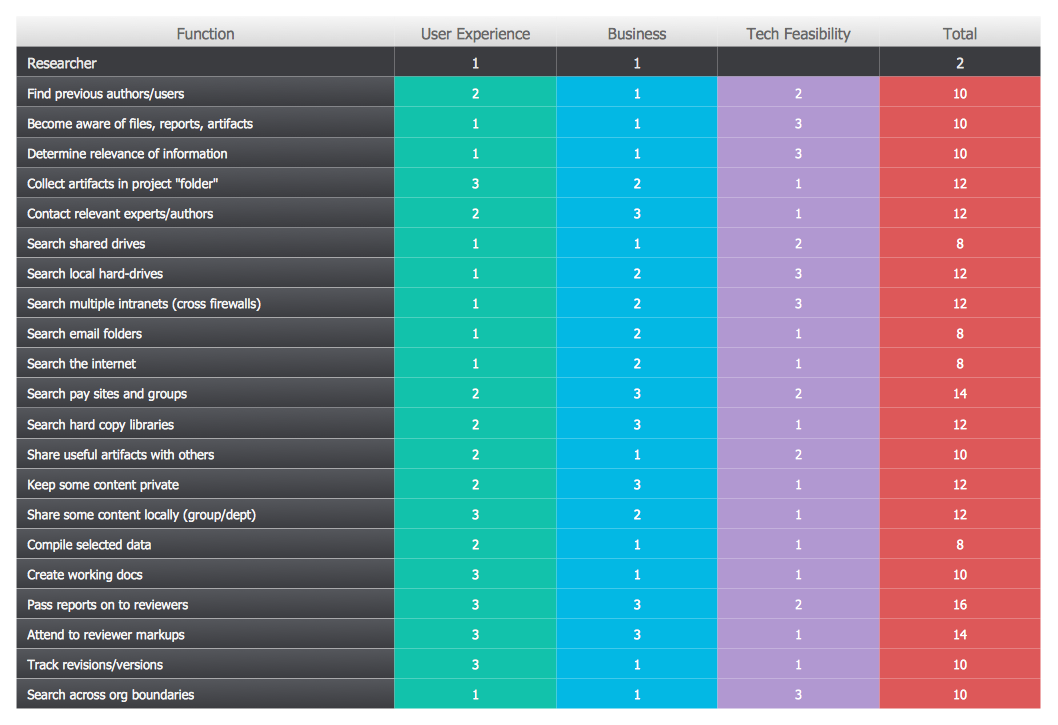
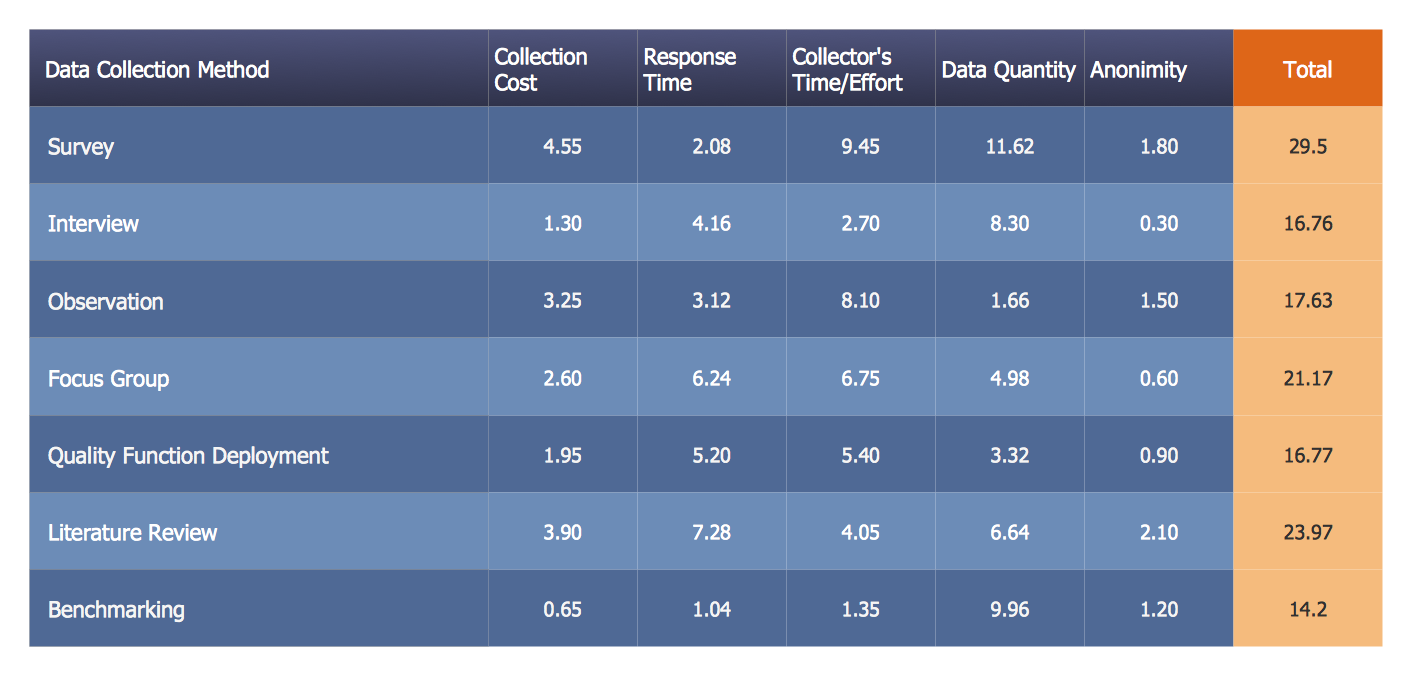
ConceptDraw OFFICE suite is a software for Prioritization Matrix diagram making. This diagram ranks the drivers’ factors to determine priority. It identifies the factors of the first priority for analysis of possible corrective actions. It assesses the weight of each factor for each criterion and specifies it in the Prioritization Matrix. The total sum of weights for a factor’s criteria indicates its priority.
PROBLEM ANALYSIS. Root Cause Analysis Tree Diagram
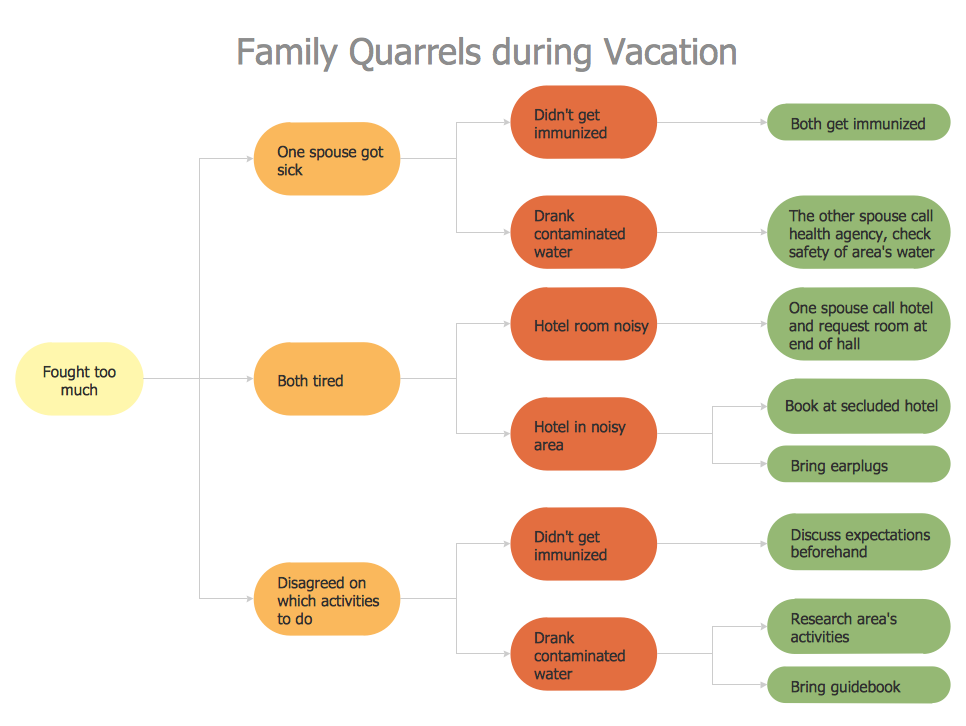
Root Cause Analysis Tree Diagram. Use the Root Cause Diagram to perform visual root cause analysis. Root Cause Analysis Tree Diagram is constructed separately for each highly prioritized factor. The goal of this is to find the root causes for the factor and list possible corrective action. ConceptDraw Office suite is a software for problem analysis.
 Stakeholder Onion Diagrams
The Stakeholder Onion Diagram is often used as a way to view the relationships of stakeholders to a project goal. A basic Onion Diagram contains a rich information. It shows significance of stakeholders that will have has influence to the success achieve
Fire Evacuation Plan Template
Have you ever created the fire plans on the base of Fire Evacuation Plan Template? It's incredibly convenient and time-saving way. Let's try to make sure this with Fire and Emergency Plans solution from the Building Plans Area for ConceptDraw DIAGRAM software.Problem solving
Problem Solving - ConceptDraw Office suite is a software for the problem solving. The Seven Management and Planning Tools solution is a set of such tools for investigating complex problems. These tools are exemplary at organizing research, parsing complex problems, providing a structure for the details, helping managers make decisions, and organizing effective communications in a visual manner that keeps everyone involved.
CORRECTIVE ACTIONS PLANNING. Risk Diagram (PDPC)
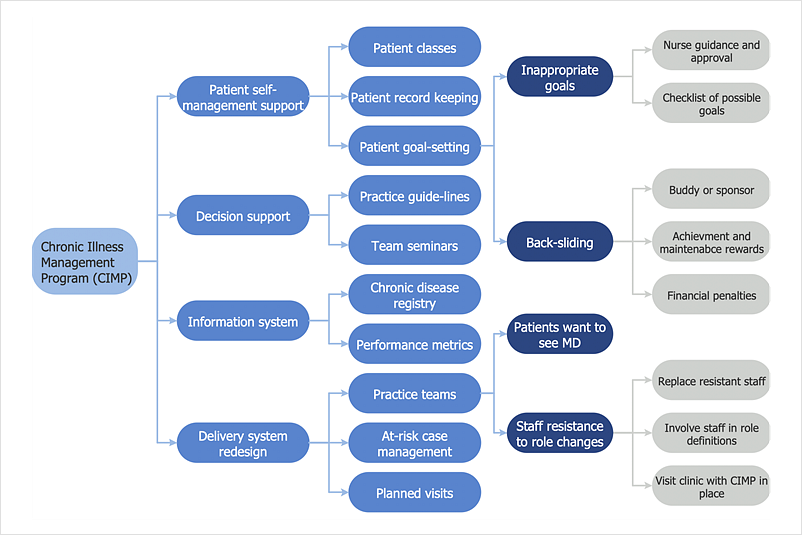
Risk Diagram (PDPC) - ConceptDraw Office suite is a software for Risks Diagram making. This diagram identifies possible risks in accomplishing corrective actions. With the Risks Diagram, one analyzes each action separately in a tree of all actions and develops a preventive action in response of each potential obstacles or circumstances which may be a risk.
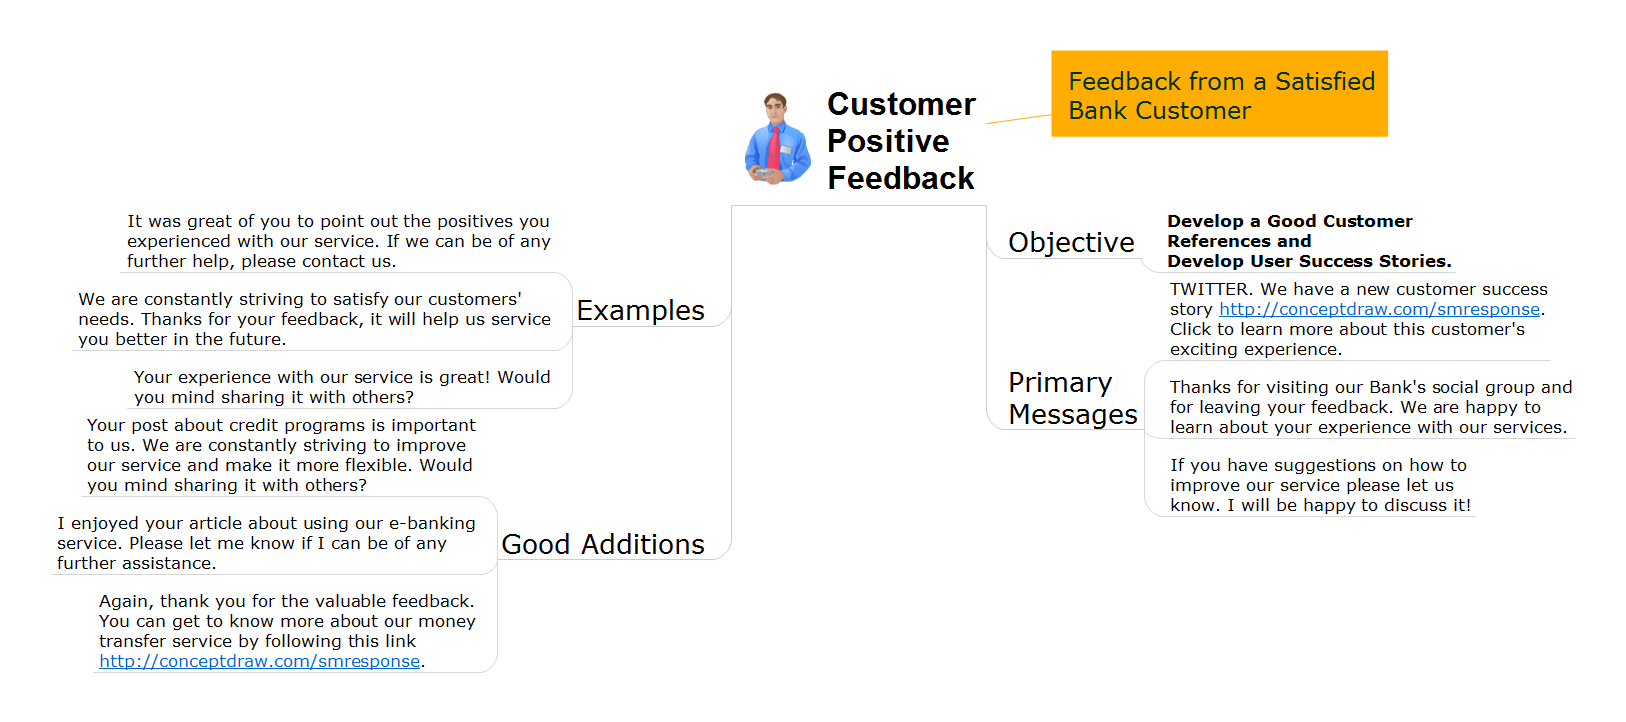
The Means to Respond to Social Media Mentions
Which trends are on the horizont of social media? What’s we have to prepare for? Look into the future with ConceptDraw products.Preventive Action
Preventive Action - ConceptDraw Office suite is a software for the Preventive Action making. The Seven Management and Planning Tools solution is a set of such tools for problems preventive actions via investigating of the core problem. Skilled use of these diagrams makes collaborative teamwork both more engaging and more effective.
Remote Projects in Corporate Strategy
Communication is the main challenge and the key success factor for organizational project management in company with remote projects. Communicating visually via Skype you bring all projects together to achieve corporate goals.
Building Drawing Software for Design Sport Fields
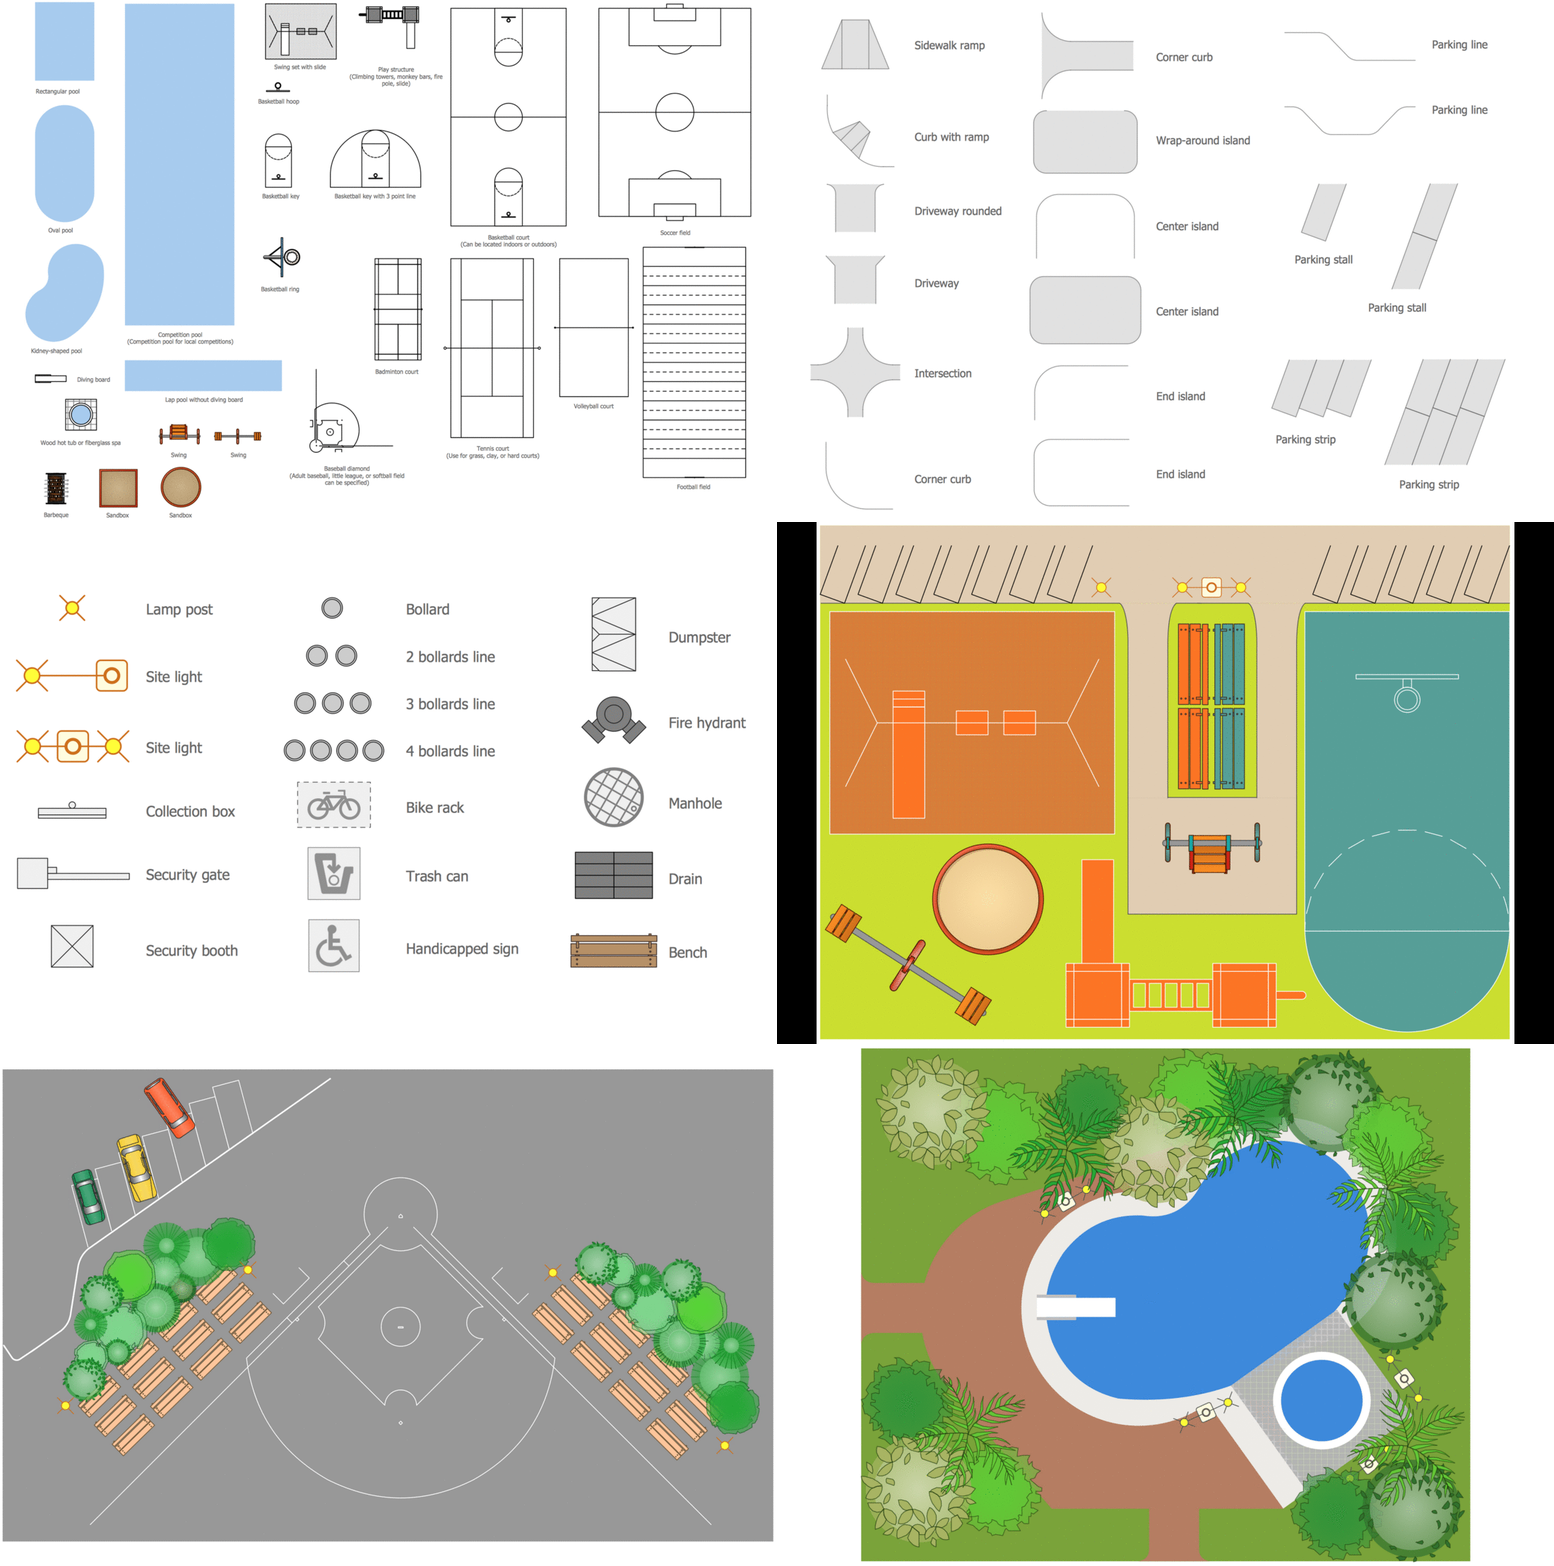
The sport fields, sport complexes, and sport grounds are popular places for all, but especially for children and teenagers who spend there a large amount of their time. So the sport fields must to be safe and carefully thought-out. Where to start and what things to consider when planning and building sport fields? First and foremost you need to take into account is that the fields for football, basketball, volleyball, tennis and other active sports differ by their dimensions, surface and design, and must to be constructed according to the rules for a given game. If the sport field assumes the presence of children of different age, you need organize the comfort staying them together. All installed elements and constructions should bring the maximum benefit and enjoyment from training. That's why the planning and construction the sport field cannot to be realized without a plan. ConceptDraw DIAGRAM building drawing software tools are perfect for design Sport Fields using the ready vector elements from the libraries of Sport Fields Plans solution from Building Plans area.
Root Cause Tree Diagram
The Root Cause Tree Diagram is a chart that helps determine the root causes of factors that influence the problem, to represent and analyze them. This diagram is constructed separately for each high priority factor. First it is needed to identify the root causes for a factor, display their structure and then propose the possible corrective actions. But how to create Root Cause Tree Diagram with the least efforts and time? ConceptDraw MINDMAP will effectively help you in drawing MINDMAP Root Cause Tree Diagram and Root Cause Analysis Tree Diagram used for further formulation of actions. The Root Cause Tree Diagram template, which can be opened at the program from the Input tab, supplies you with a basic mind map structure for your diagram. The central idea describes briefly a problem, the main topics represent the high-level causes of a problem, their subtopics give more details about the different parts of given causes. At the last level of tree are described the potential solutions to each of detailed parts of the causes.HelpDesk
How To Create an Involvement Matrix
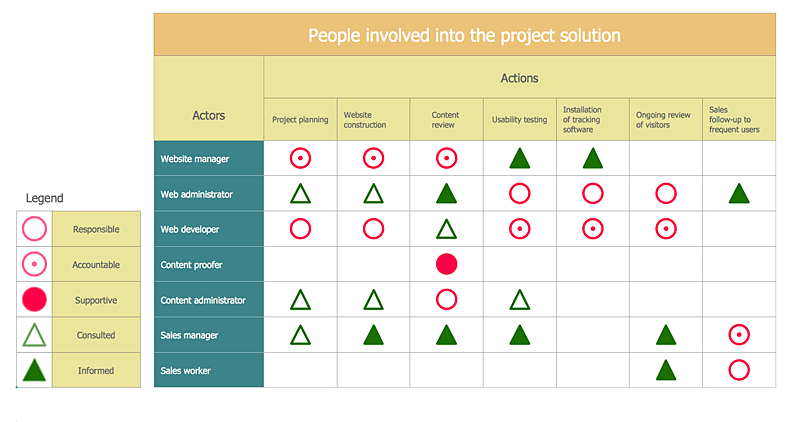
The Involvement Matrix can identify the distribution of responsibilities and identify roles in a group or team. This matrix can be used company-wide. The Involvement Matrix identifies participants who are involved in corrective actions. The Involvement Matrix is constructed for all highly prioritized corrective actions. It uses symbols to assign who participates, performs, consults, should be informed, checks the work, and accepts the results. Using visual diagrams keeps ideas clear and is very effective when discussing the problem and a description of the solution. They are great at helping to quickly see what stage of the problem-solving effort is currently underway. It defines the participants and their roles. The matrix displays all of the parties involved, defines their level of involvement, and the nature of their participation. The ability to create an Involvement Matrix is supported by the ConceptDraw Seven Management and Planning Tools solution.Ring Network Topology
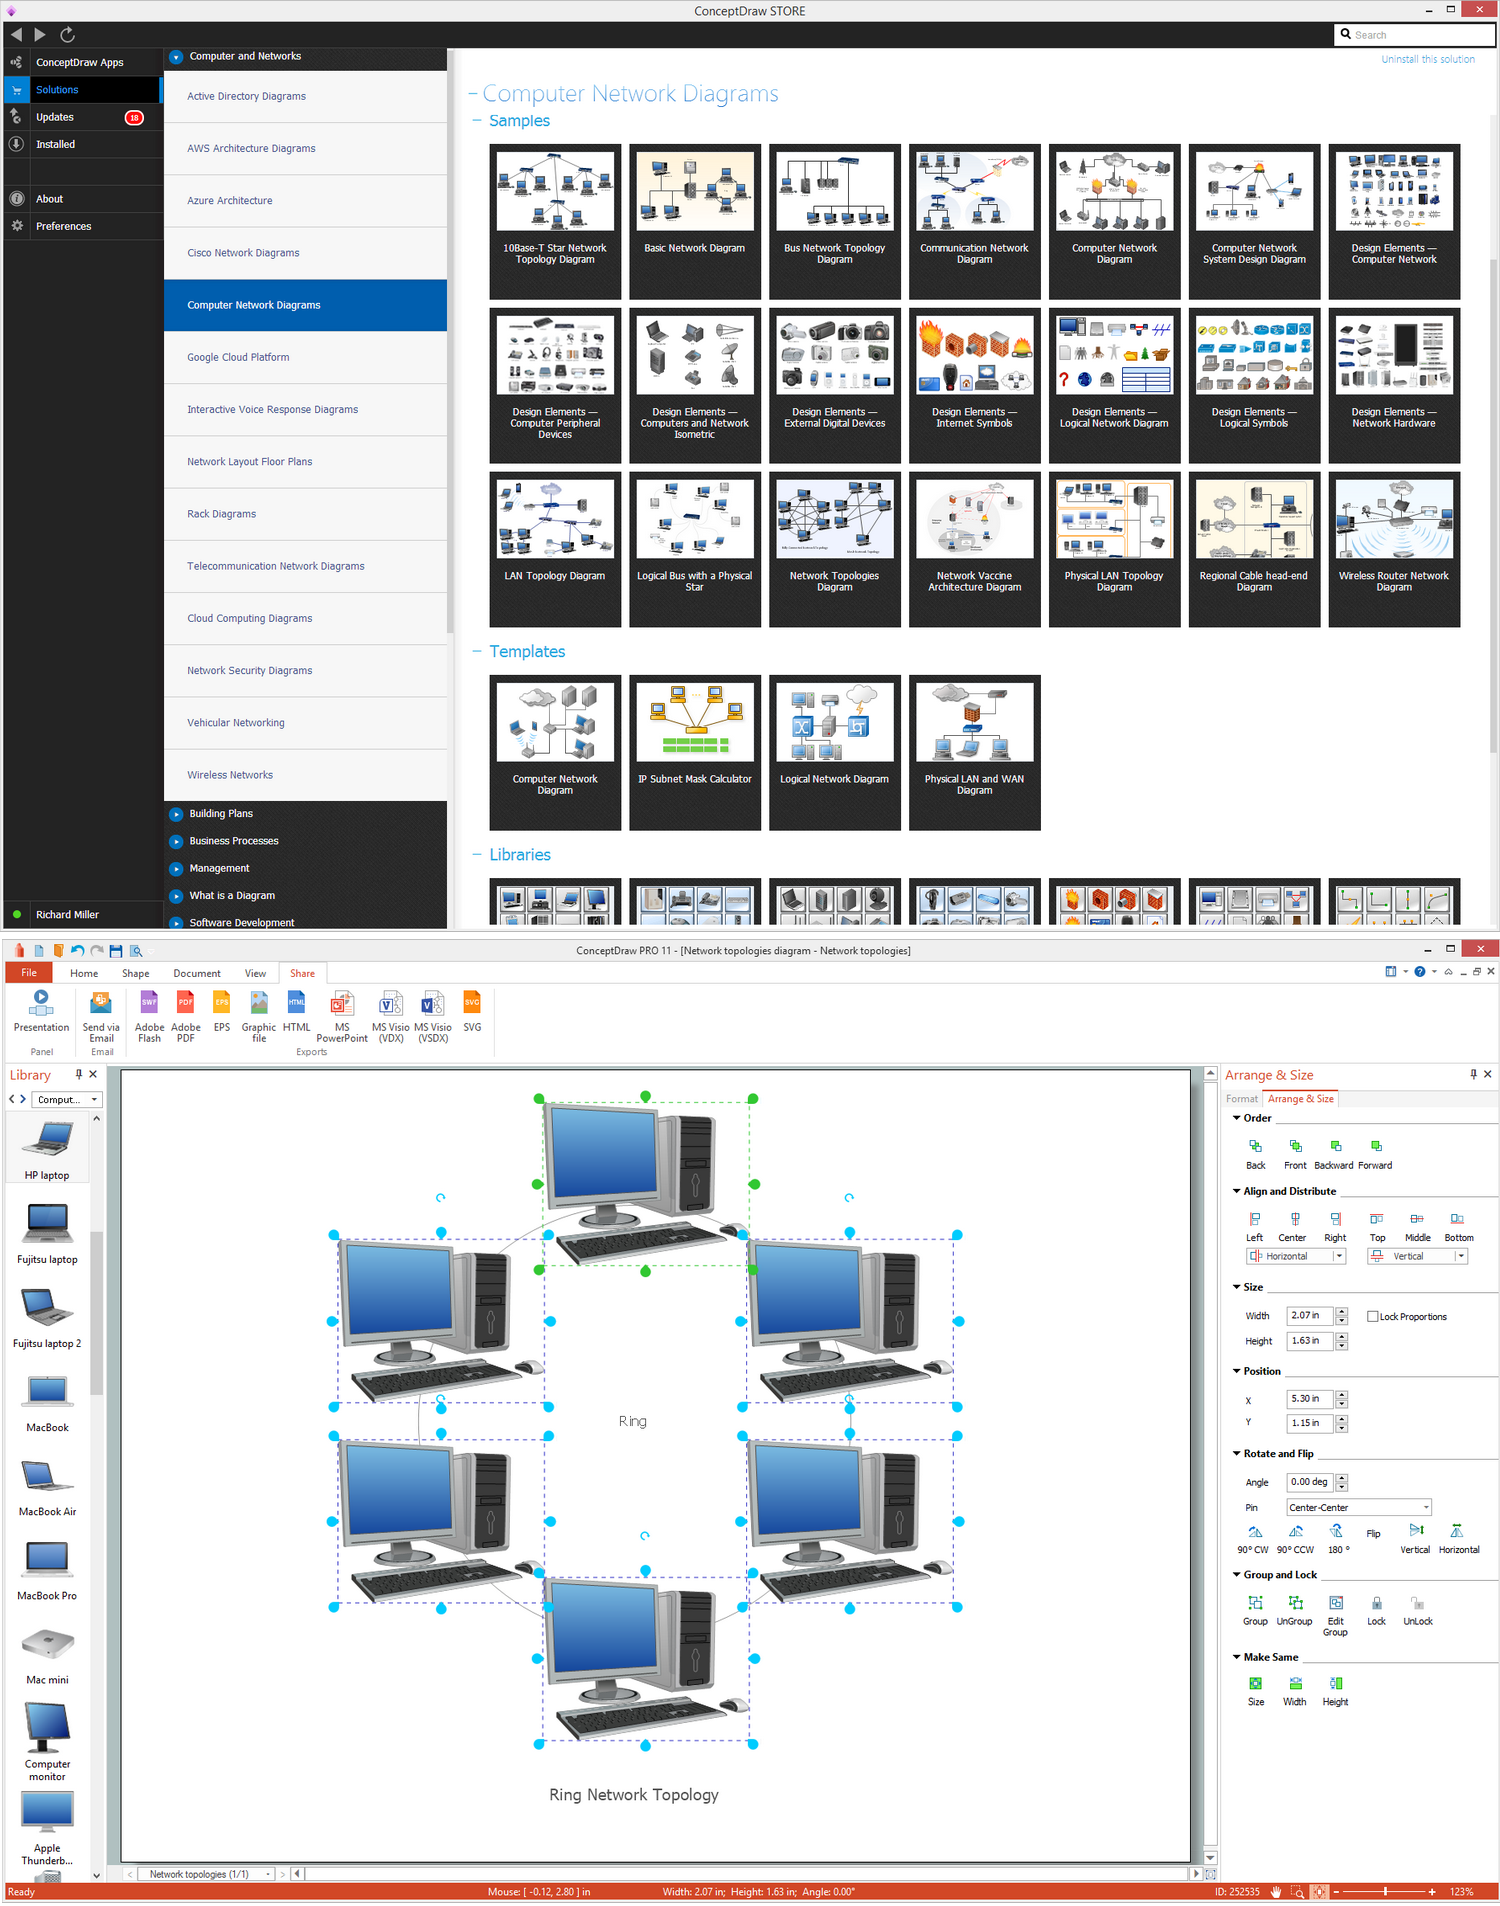
The Ring Network Topology Diagram examples was created using ConceptDraw DIAGRAM software with Computer and Networks solution.- Person involvement matrix - Template | The Action Plan | Matrix ...
- Problem solving | PROBLEM ANALYSIS. Identify and Structure ...
- 7 Management & Planning Tools | PROBLEM ANALYSIS. Identify ...
- Seven Management and Planning Tools | PROBLEM ANALYSIS ...
- The Action Plan | Person involvement matrix - Template ...
- 7 Management & Planning Tools | Seven Management and ...
- PROBLEM ANALYSIS. Prioritization Matrix | Cause and Effect ...
- CORRECTIVE ACTIONS PLANNING . PERT Chart | PROBLEM ...
- Person involvement matrix - Template | Responsibility assignment ...
- Schedule pie chart - Daily action plan | Chart Maker for ...
- Organizational Structure Total Quality Management | Flowchart ...
- PROBLEM ANALYSIS. Identify and Structure Factors | Affinity ...
- Emergency Plan | Fire and Emergency Plans | Emergency Action ...
- CORRECTIVE ACTIONS PLANNING . Involvement Matrix | TQM ...
- How To Create Root Cause Analysis Diagram Using Solutions ...
- The Action Plan | Cause and Effect Analysis | Root Cause Tree ...
- PROBLEM ANALYSIS. Prioritization Matrix | Matrix Organization ...
- The Action Plan | CORRECTIVE ACTIONS PLANNING. Involvement ...
- PROBLEM ANALYSIS. Identify and Structure Factors | Cause and ...
- Matrix Organization Structure | How to Draw a Matrix Organizational ...
