CORRECTIVE ACTIONS PLANNING. PERT Chart


PROBLEM ANALYSIS. Identify and Structure Factors

Problem solving

Preventive Action

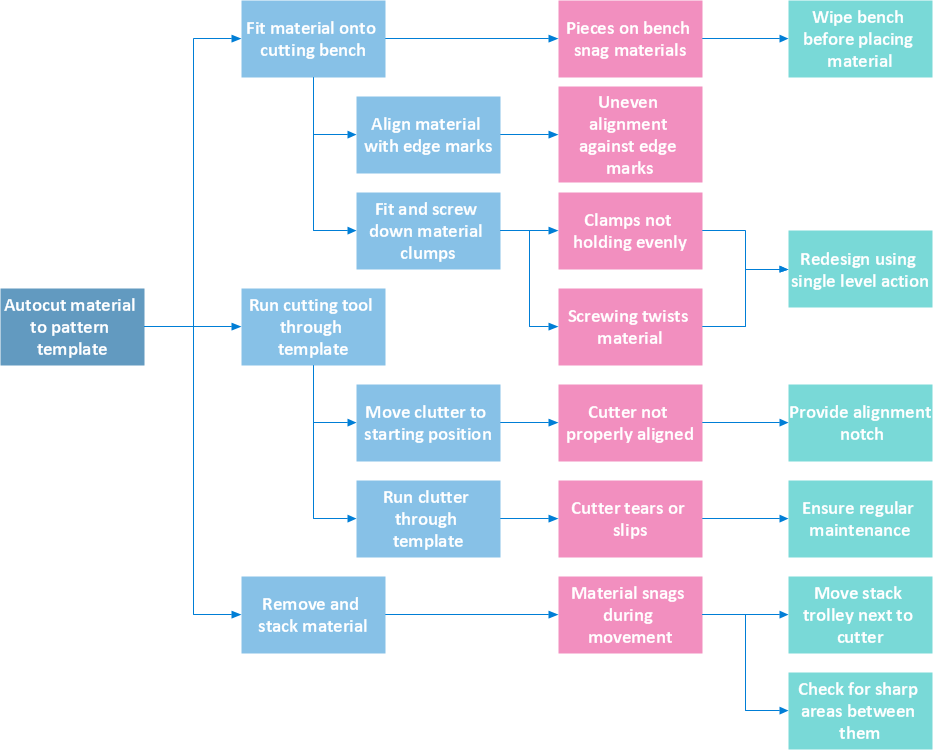
Root Cause Analysis

Corrective Action Planning

Risk Analysis
CORRECTIVE ACTIONS PLANNING. Risk Diagram (PDPC)

PROBLEM ANALYSIS. Relations Diagram

The Action Plan

- Problem Analysis Chart Example
- Process Flowchart | PROBLEM ANALYSIS . Root Cause Analysis ...
- PROBLEM ANALYSIS . Prioritization Matrix | PROBLEM ANALYSIS ...
- Draw Fishbone Diagram on MAC Software | PROBLEM ANALYSIS ...
- PERT chart - Template | PROBLEM ANALYSIS . Prioritization Matrix ...
- PROBLEM ANALYSIS . Relations Diagram | Seven Management ...
- PROBLEM ANALYSIS . Root Cause Analysis Tree Diagram | Root ...
- Simple Flow Chart | Competitor Analysis | Total Quality Management ...
- How To Make a Bubble Chart | PROBLEM ANALYSIS . Identify and ...
- Flowchart Example: Flow Chart of Marketing Analysis | Competitor ...