How To Make a Bubble Chart
Bubble diagrams solution extends ConceptDraw DIAGRAM software with templates, Using ConceptDraw Connectors, you can make a bubble chart in moments. Using ConceptDraw you will be able to make a bubble chart from the ready ConceptDraw library objects or make your own objects. The created diagram can represent ideas organization, in brainstorming processes, by teachers for explaining difficult ideas or for presentations.PROBLEM ANALYSIS. Identify and Structure Factors
Identify and Structure Factors. Use the Affinity Diagram to collect and structure factors that impact on a problem.ConceptDraw OFFICE suite is a software for identify and structure factors with affinity diagram. This is a grouping and structuring of factors that impact on a problem.
How to Draw a Bubble Chart
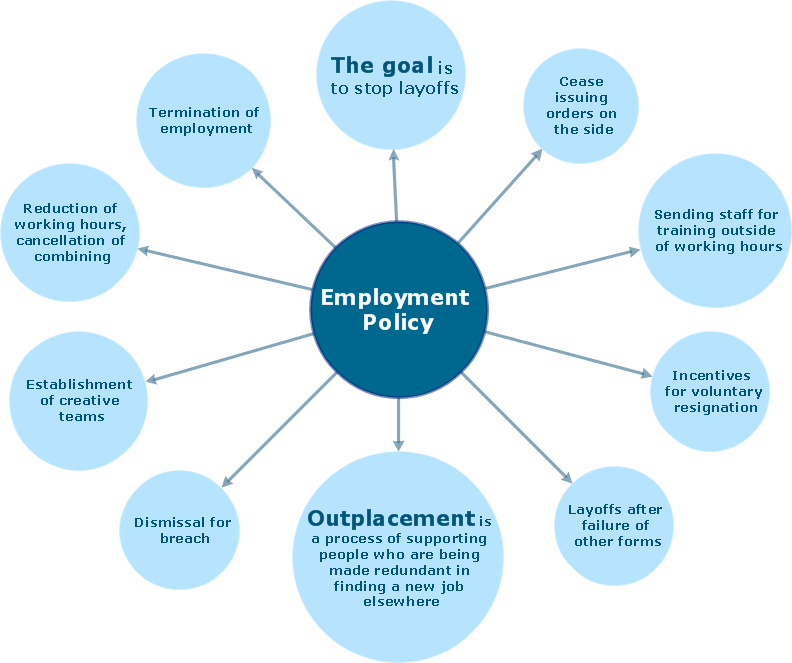
Video tutorials on ConceptDraw products. Try it today!Bubble Diagrams
Bubble diagrams have enjoyed great success in software engineering, architecture, economics, medicine, landscape design, scientific and educational process, for ideas organization during brainstorming, for making business illustrations, presentations, planning, design, and strategy development. They are popular because of their simplicity and their powerful visual communication attributes.
HelpDesk
How to Add a Bubble Diagram to PowerPoint Presentation
Bubble diagrams can be used to compare concepts and identify areas of similarity and difference. ConceptDraw DIAGRAM allows you to make an MS PowerPoint Presentation from your charts in a few simple steps. A bubble diagram is a chart that represents information visually in the form of a series of bubbles. Bubble charts are often used in marketing and management during the early stages of product development to visualize ideas and concepts by organizing them in a hierarchy. The ability to create this form of a diagram is contained within the Bubble Diagrams solution. A PowerPoint presentation of bubble diagrams can be used to demonstrate and identify areas of similarity and difference of featured business ideas and concepts.ConceptDraw Arrows10 Technology
When you are connecting existing objects you can control the diagram structure by changing selection order.This is how diagramming software should work. You are able to draw a diagram as quickly as the ideas come to you.
How to Draw an Organization Chart
How to Draw an Organization Chart - The innovative ConceptDraw Arrows10 Technology included in ConceptDraw DIAGRAM is a powerful drawing tool that changes the way diagrams are produced.While making the drawing process easier and faster.
Video tutorial on creating orgchart with ConceptDraw products. Try ConceptDraw for creating orgchart professional presentations!
How To Create a Bubble Chart
Bubble diagrams solution extends ConceptDraw DIAGRAM software with templates, Using ConceptDraw Connectors, you can create a bubble chart in moments.Using ConceptDraw you will be able to create a bubble chart from the ready ConceptDraw library objects or make your own objects. The created diagram can represent ideas organization, in brainstorming processes, by teachers for explaining difficult ideas or for presentations.
The Best Flowchart Software Available
ConceptDraw gives the ability to draw Flowchart documents. Flowcharts solutionis a powerful tool that extends ConceptDraw application for drawing business flowcharts.ConceptDraw DIAGRAM vector diagramming and business graphics software enhanced with with templates, green and interactive flowchart makers, samples and stencil libraries from ConceptDraw Solution Park which all focused to help with drawing flowcharts, block diagrams, bar charts, histograms, pie charts, divided bar diagrams, line graphs, area charts, scatter plots, circular arrows diagrams, Venn diagrams, bubble diagrams, concept maps, and others.
ConceptDraw Arrows10 Technology
How should diagramming software work? The answer is - Fast and easy."Tree"- mode drawing works like that. Just select objects in your drawing and press Tree or Chain button to connect all of them just in one click.
Your diagram looks professional and it took only a moment to draw.
- Bubble Chart | How To Make a Bubble Chart | How to Draw a ...
- AWS Architecture Diagrams | Bubble Diagrams | Fault Tree Analysis ...
- How to Add a Bubble Diagram to a PowerPoint Presentation Using ...
- How to Draw a Landscape Design Plan | Bubble Diagrams ...
- Bubble Diagrams | Data structure diagram with ConceptDraw PRO ...
- How to Create a Fault Tree Analysis Diagram (FTD) in ConceptDraw ...
- Fault Tree Analysis Diagrams | Bubble Diagram Of Accident And ...
- Design elements - Trees and plants | Landscape & Garden | Bubble ...
- Trees and plants - Vector stencils library | Bubble diagrams in ...
- Design elements - Transparent trees | Network Diagram Software ...
- ERD | Entity Relationship Diagrams, ERD Software for Mac and Win
- Flowchart | Basic Flowchart Symbols and Meaning
- Flowchart | Flowchart Design - Symbols, Shapes, Stencils and Icons
- Flowchart | Flow Chart Symbols
- Electrical | Electrical Drawing - Wiring and Circuits Schematics
- Flowchart | Common Flowchart Symbols