Diagramming Software for Design UML State Machine Diagrams


Design Elements for UML Diagrams

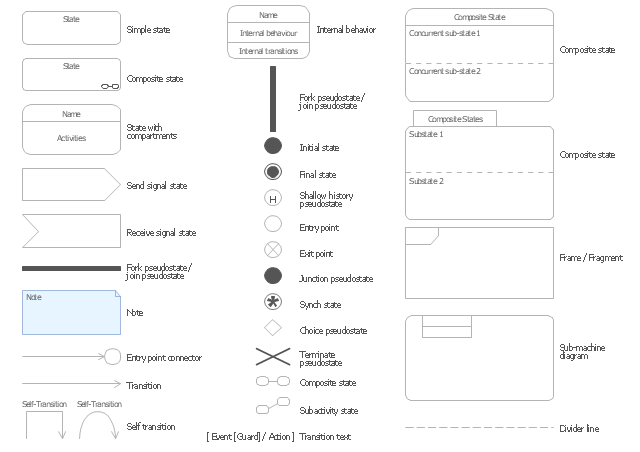
The vector stencils library "UML state machine diagrams" contains 35 symbols for the ConceptDraw PRO diagramming and vector drawing software.
"The state diagram in the Unified Modeling Language is essentially a Harel statechart with standardized notation, which can describe many systems, from computer programs to business processes. In UML 2 the name has been changed to State Machine Diagram. The following are the basic notational elements that can be used to make up a diagram:
(1) Filled circle, pointing to the initial state.
(2) Hollow circle containing a smaller filled circle, indicating the final state (if any).
(3) Rounded rectangle, denoting a state. Top of the rectangle contains a name of the state. Can contain a horizontal line in the middle, below which the activities that are done in that state are indicated.
(4) Arrow, denoting transition. The name of the event (if any) causing this transition labels the arrow body. A guard expression may be added before a "/ " and enclosed in square-brackets ( eventName[guardExpression] ), denoting that this expression must be true for the transition to take place. If an action is performed during this transition, it is added to the label following a "/ " ( eventName[guardExpression]/ action ).
(5) Thick horizontal line with either x>1 lines entering and 1 line leaving or 1 line entering and x>1 lines leaving. These denote join/ fork, respectively." [State diagram (UML). Wikipedia]
The example "Design elements - UML state machine diagrams" is included in the Rapid UML solution from the Software Development area of ConceptDraw Solution Park.
UML state machine diagram symbols
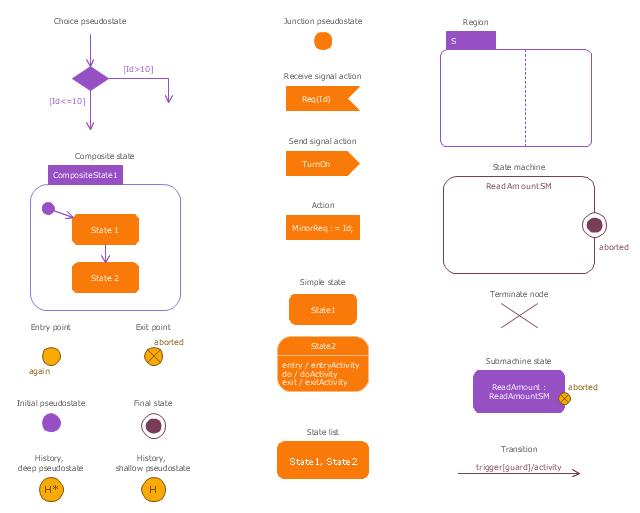
State Diagram Example — Online Store

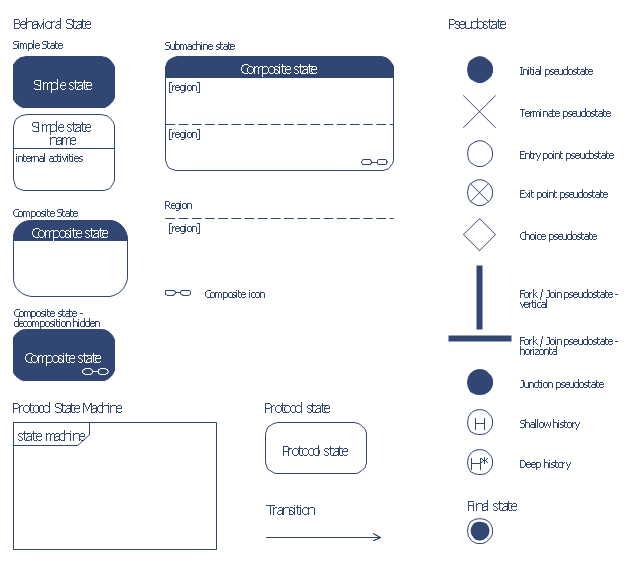
The vector stencils library "State machine diagram" contains 20 SysML symbols.
Use it to design your state machine diagrams using ConceptDraw PRO diagramming and vector drawing software.
"The state diagram in the Unified Modeling Language is essentially a Harel statechart with standardized notation, which can describe many systems, from computer programs to business processes. In UML 2 the name has been changed to State Machine Diagram. The following are the basic notational elements that can be used to make up a diagram:
- Filled circle, representing to the initial state
- Hollow circle containing a smaller filled circle, indicating the final state (if any)
- Rounded rectangle, denoting a state. Top of the rectangle contains a name of the state. Can contain a horizontal line in the middle, below which the activities that are done in that state are indicated
- Arrow, denoting transition. The name of the event (if any) causing this transition labels the arrow body. A guard expression may be added before a "/ " and enclosed in square-brackets ( eventName[guardExpression] ), denoting that this expression must be true for the transition to take place. If an action is performed during this transition, it is added to the label following a "/ " ( eventName[guardExpression]/ action ).
- Thick horizontal line with either x>1 lines entering and 1 line leaving or 1 line entering and x>1 lines leaving. These denote join/ fork, respectively." [State diagram (UML). Wikipedia]
The SysML shapes example "Design elements - State machine diagram" is included in the SysML solution from the Software Development area of ConceptDraw Solution Park.
SysML state machine diagram symbols
The vector stencils library "Bank UML state machine diagram" contains 21 shapes for drawing UML state machine diagrams.
Use it for object-oriented modeling of your bank information system.
"The state diagram in the Unified Modeling Language is essentially a Harel statechart with standardized notation, which can describe many systems, from computer programs to business processes. In UML 2 the name has been changed to State Machine Diagram. The following are the basic notational elements that can be used to make up a diagram:
* Filled circle, pointing to the initial state.
* Hollow circle containing a smaller filled circle, indicating the final state (if any).
* Rounded rectangle, denoting a state. Top of the rectangle contains a name of the state. Can contain a horizontal line in the middle, below which the activities that are done in that state are indicated.
* Arrow, denoting transition. The name of the event (if any) causing this transition labels the arrow body. A guard expression may be added before a "/ " and enclosed in square-brackets ( eventName[guardExpression] ), denoting that this expression must be true for the transition to take place. If an action is performed during this transition, it is added to the label following a "/ " ( eventName[guardExpression]/ action ).
* Thick horizontal line with either x>1 lines entering and 1 line leaving or 1 line entering and x>1 lines leaving. These denote join/ fork, respectively." [State machine diagram. Wikipedia]
This example of UML state machine diagram symbols for the ConceptDraw PRO diagramming and vector drawing software is included in the ATM UML Diagrams solution from the Software Development area of ConceptDraw Solution Park.
UML state machine diagram symbols
ConceptDraw DIAGRAM UML Diagrams with ConceptDraw DIAGRAM

OMT Method

 SYSML
SYSML
In order to make a SysML-related drawing, the ConceptDraw DIAGRAM charting and drawing software can be used. Also, the SysML solution can be found as an extension to the ConceptDraw DIAGRAM application, enabling all those with systems engineering background to use the offered tools for creating the needed systems process models in order to use in the professional documentation for either distribution or analysis. Offering the vector stencil libraries full of the icons that may relate to each of the 9 official diagrams used in SysML, the SysML solution is useful for many system engineers.
SysML

UML Notation

UML Diagrams with ConceptDraw DIAGRAM

Software and Database Design with ConceptDraw DIAGRAM

UML Diagram

The Best Tool for Business Process Modeling

UML Diagram for Mac

 Jackson Structured Programming (JSP) Diagrams
The Jackson Structured Programming (JSP) Diagram solution extends the functionality and drawing abilities of the ConceptDraw DIAGRAM software with set of illustrative JSP diagrams samples and large variety of predesigned vector objects of actions, processes, procedures, selection, iteration, as well as arrows and connectors to join the objects during Jackson structured development and designing Jackson structured programming diagrams, JSP diagram, Jackson structure diagram (JSD), Program structure diagram. The powerful abilities of this solution make the ConceptDraw DIAGRAM ideal assistant for programmers, software developers, structural programmers, computer engineers, applications constructors, designers, specialists in structured programming and Jackson systems design, and other technical, computer and software specialists.
UML Tool & UML Diagram Examples

Flow Chart Symbols

Data Flow Diagram Symbols. DFD Library

- ATM UML Diagrams | Atm State Diagram In Software Engineering
- State Diagram Example — Online Store | UML State Machine ...
- Diagram Of State Machine Model In Software Engineering
- UML state machine diagram - Template | Rapid UML | Design ...
- State Diagram Example — Online Store | Design elements - UML ...
- ConceptDraw PRO UML Diagrams with ConceptDraw PRO ...
- State Diagram Example - Online Store | IDEF3 Standard | UML ...
- UML State Machine Diagram. Design Elements
- Design elements - Bank UML state machine diagram | Design ...