Pic. 1. OMT object diagram.
All diagrams produced with ConceptDraw DIAGRAM are vector graphic documents and are available for reviewing, modifying, and converting to a variety of formats (image, HTML, PDF file, MS PowerPoint Presentation, Adobe Flash or MS Visio).
TEN RELATED HOW TO's:
A Data Flow Diagram (DFD) is a graphical technique which allows effectively model and analyze the information processes and systems. The ability to fast and easy create the DFDs is made possible with Data Flow Diagrams solution from the Software Development area of ConceptDraw Solution Park. For designing the Data Flow Diagrams are used simple DFD flowchart symbols which are connected each other by arrows depicting the data flow from one step to another.
Picture: DFD Flowchart Symbols
Related Solution:
UML Package Diagram illustrates the functionality of a software system.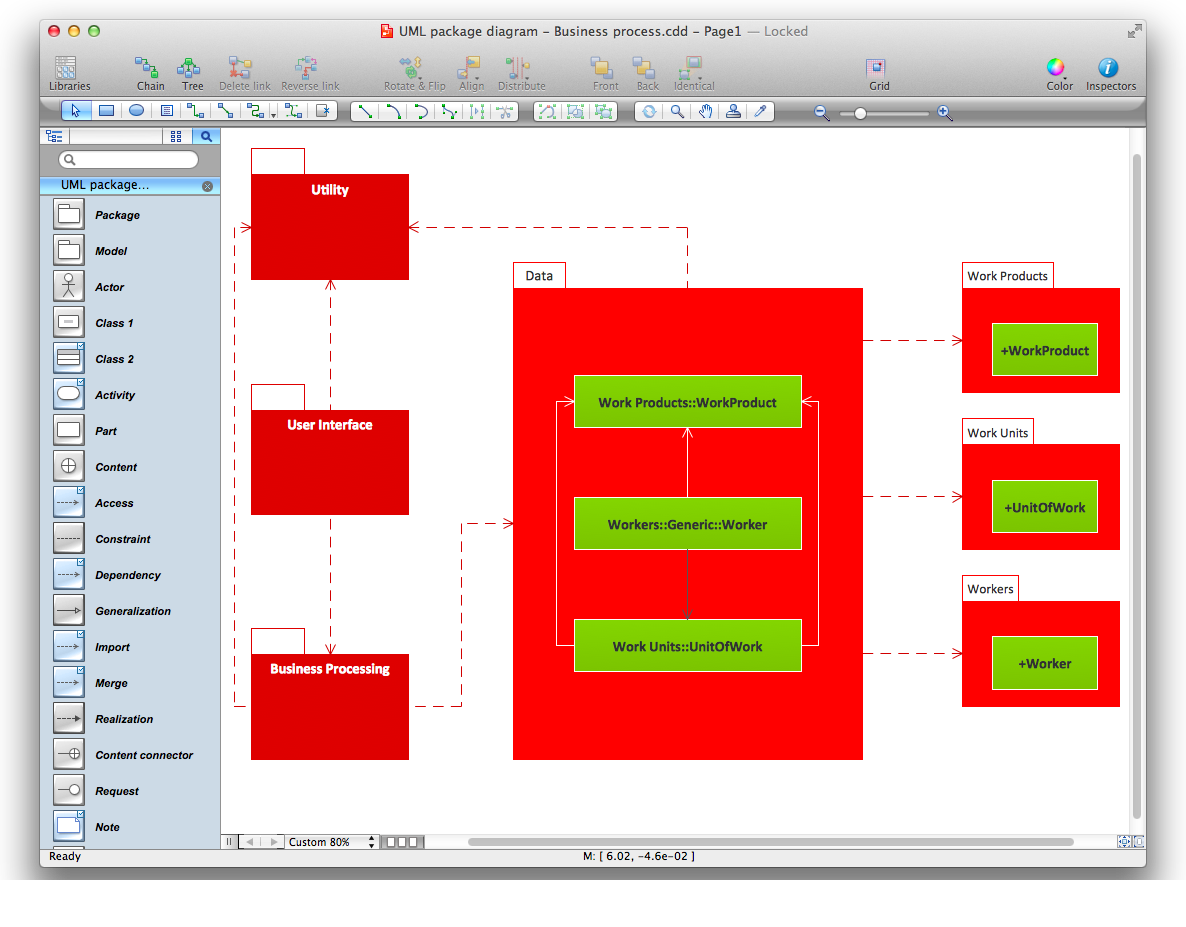
Picture: Diagramming Software for Design UML Package Diagrams
A full-featured project management solution with all the necessary functions right at your fingertips. Generates an extensive variety of reports on project and task statuses.
These videos provide a series of lessons that will enhance the understanding of all our users, from people just starting out with the software, through to expert users.
Picture: Project — Working With Tasks
UML Diagram Estate Agency. This sample was created in ConceptDraw DIAGRAM diagramming and vector drawing software using the UML Use Case Diagram library of the Rapid UML Solution from the Software Development area of ConceptDraw Solution Park.
This sample shows the work of the estate agency and is used by the estate agencies, building companies, at the trainings of the estate agencies, for understanding the working processes of the estate agencies.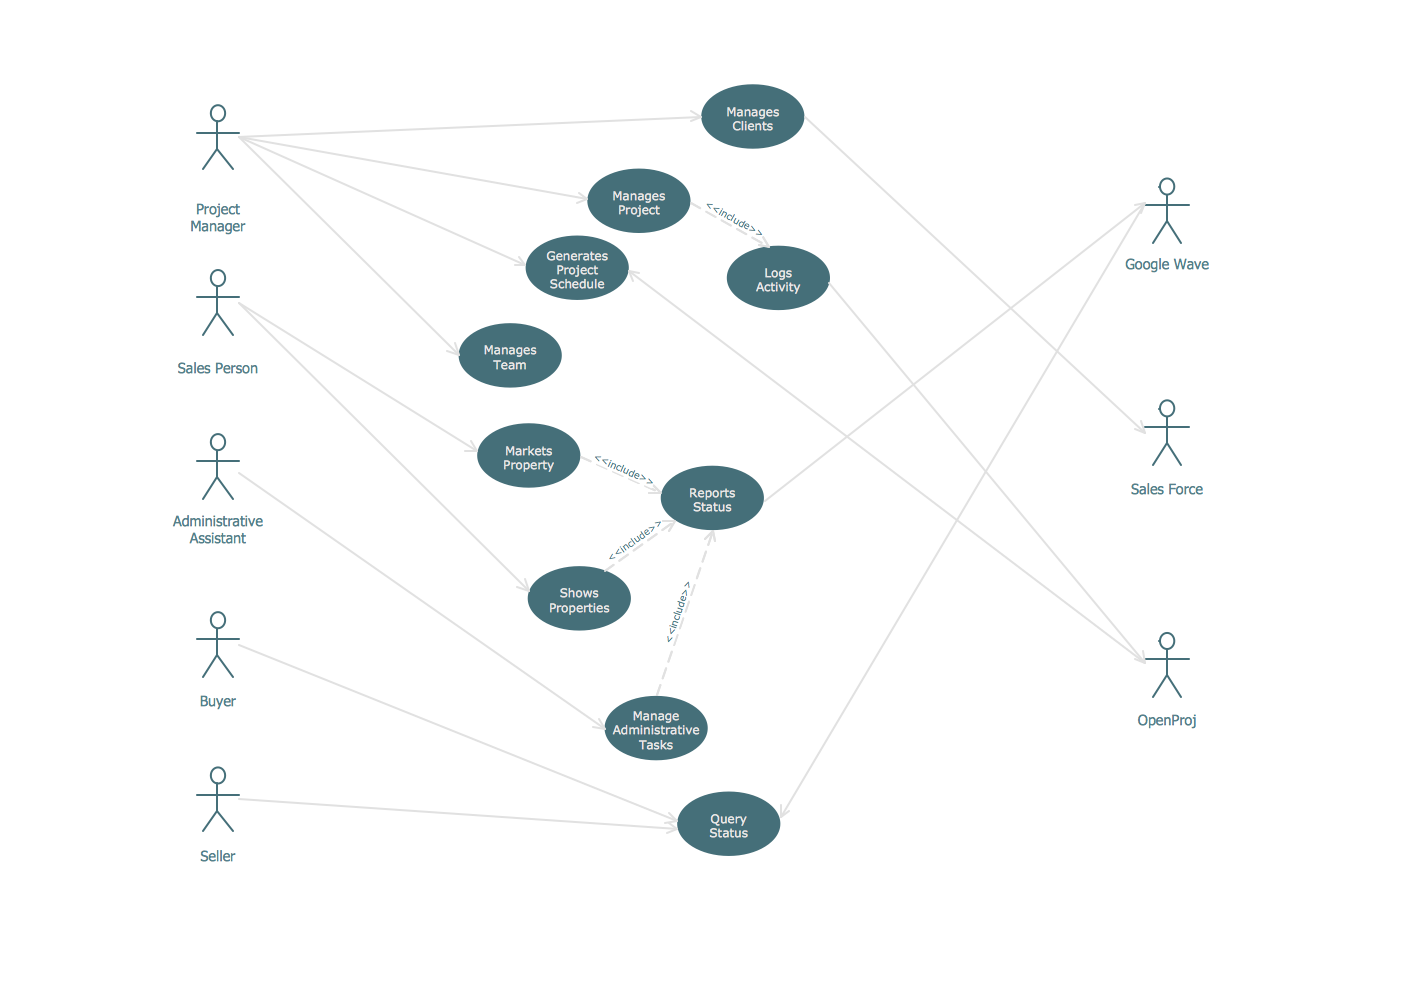
Picture: UML Use Case Diagram Example - Estate Agency
Related Solution:
This sample was created on the Mac in ConceptDraw DIAGRAM diagramming and vector drawing software using the UML State Machine Diagram library of the Rapid UML Solution from the Software Development area of ConceptDraw Solution Park.
Picture: UML Diagram for Mac
Related Solution:
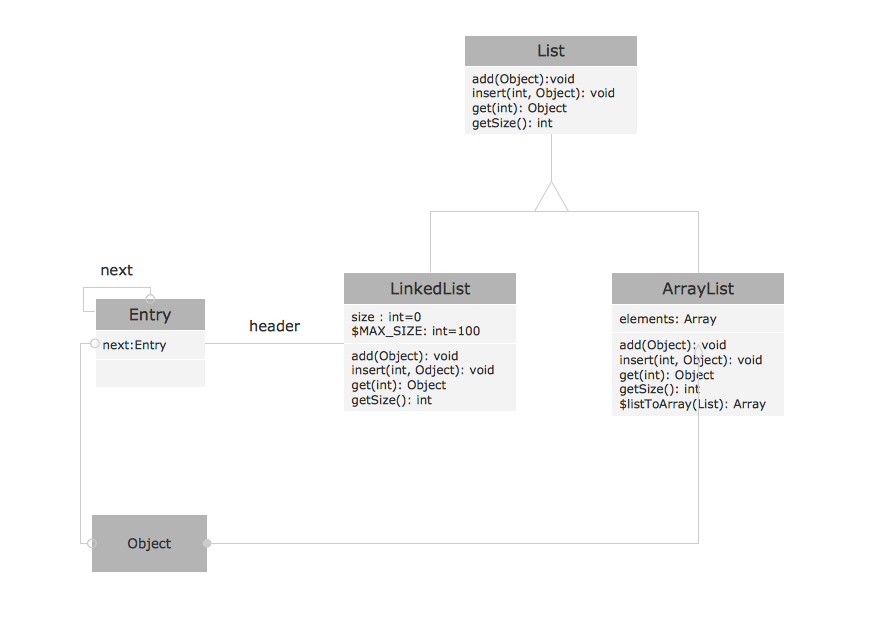
This sample was created in ConceptDraw DIAGRAM diagramming and vector drawing software using the UML Class Diagram library of the Rapid UML Solution from the Software Development area of ConceptDraw Solution Park.
This sample describes the use of the classes, the generalization associations between them, the multiplicity of associations and constraints. Provided UML diagram is one of the examples set that are part of Rapid UML solution.
Picture: UML Class Diagram Generalization ExampleUML Diagrams
Related Solution:
Ultra high frequency (UHF) is the ITU designation for radio frequencies in the range between 300 MHz and 3 GHz, also known as the decimetre band as the wavelengths range from one meter to one decimetre. Radio waves with frequencies above the UHF band fall into the SHF (super-high frequency) or microwave frequency range. Lower frequency signals fall into the VHF (very high frequency) or lower bands. UHF radio waves propagate mainly by line of sight; they are blocked by hills and large buildings although the transmission through building walls is strong enough for indoor reception. They are used for television broadcasting, cell phones, satellite communication including GPS, personal radio services including Wi-Fi and Bluetooth, walkie-talkies, cordless phones, and numerous other applications.
26 libraries of the Electrical Engineering Solution of ConceptDraw DIAGRAM make your electrical diagramming simple, efficient, and effective. You can simply and quickly drop the ready-to-use objects from libraries into your document to create the electrical diagram.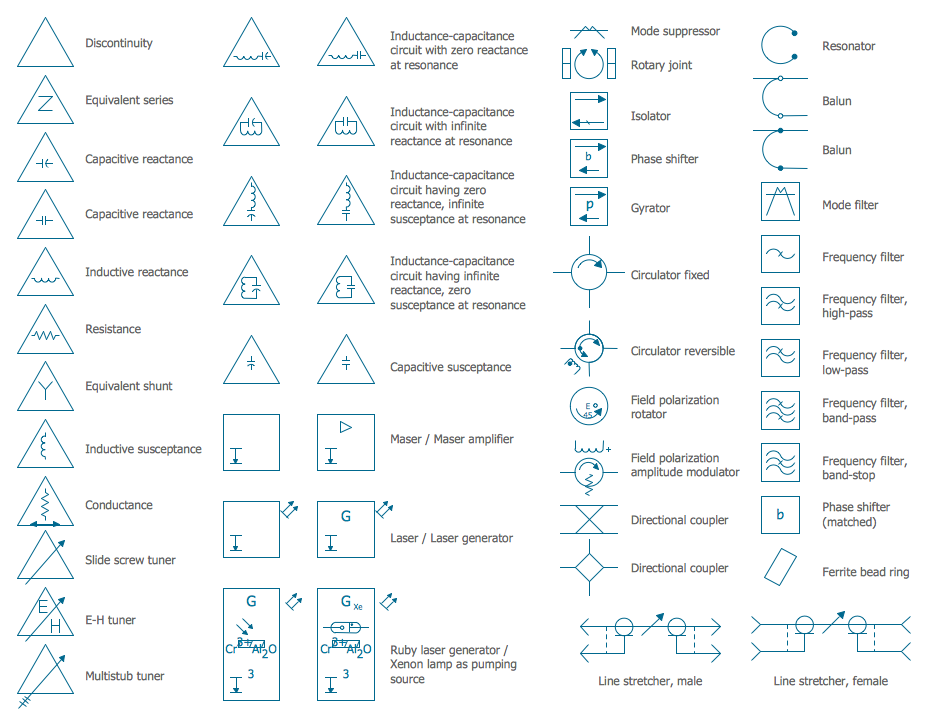
Picture: Electrical Symbols — VHF UHF SHF
Related Solution:
Electrical Engineering Solution used together with ConceptDraw DIAGRAM drawing facilities makes short a work of drawing various electrical and electronic circuit schemes. A library of vector objects composed from symbols of Analog and Digital Logic elements of electric circuit includes 40 symbolic images of logic gates, bistable switches of bi-stable electric current, circuit controllers, amplifiers, regulators, generators, etc. All of them can be applied in electronic circuit schemes for showing both analog and digital elements of the circuit.
Electrical Engineering Solution used together with ConceptDraw DIAGRAM drawing facilities makes short a work of drawing various electrical and electronic circuit schemes. A library of vector objects composed from symbols of Analog and Digital Logic elements of electric circuit includes 40 symbolic images of logic gates, bistable switches of bi-stable electric current, circuit controllers, amplifiers, regulators, generators, etc. All of them can be applied in electronic circuit schemes for showing both analog and digital elements of the circuit.
Picture:
Electrical Diagram Symbols F.A.Q.
How to Use Electrical ConceptDraw Diagram Software
Related Solution:
The ConceptDraw vector stencils library Cisco Products Additional contains equipment symbols for drawing the computer network diagrams.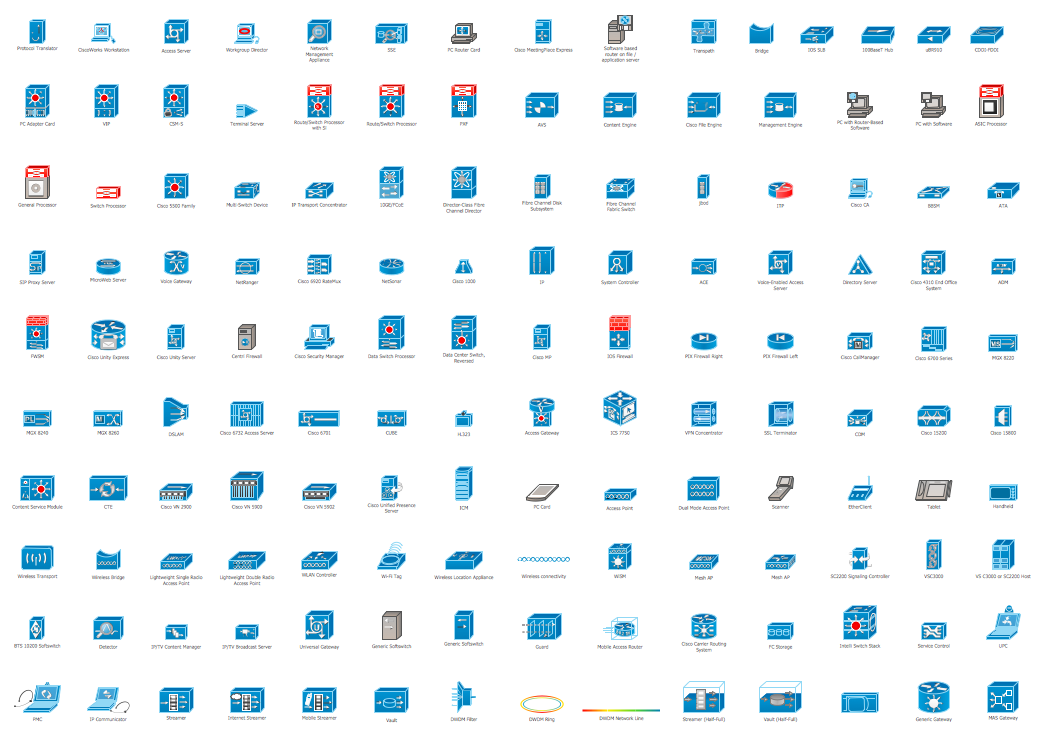
Picture: Cisco Products Additional. Cisco icons, shapes, stencils and symbols
Related Solution:
A Telecommunications network is a network of nodes, links, trunks and telephone switches that are connected, operated by telephone companies and realize telephone, audio, visual and data communications among the users. The telecommunications network can also include Internet, microwave, wireless equipment.
This example was created in ConceptDraw DIAGRAM using the Computer and Networks Area of ConceptDraw Solution Park and shows the Telecommunications network.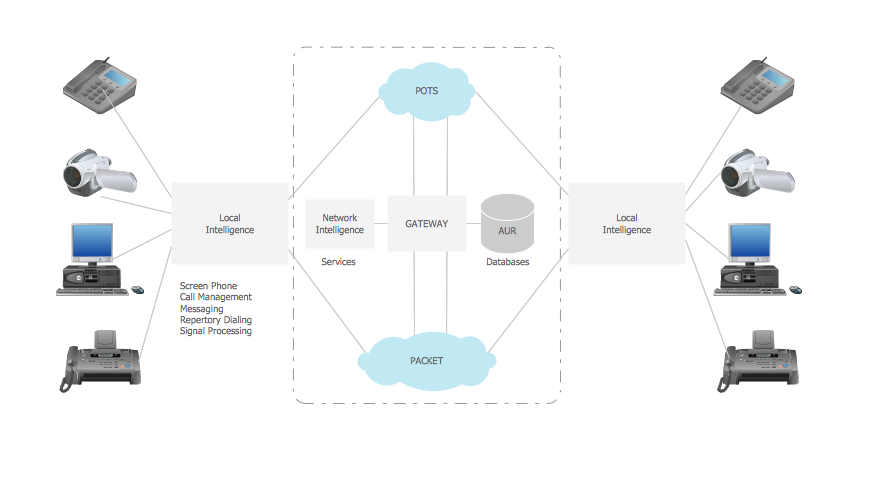
Picture: Telecommunication networks. Computer and Network Examples
Related Solution: