Balanced Scorecard Software

"Dashboards give signs about a business letting the user know something is wrong or something is right. ...
Balanced Scoreboards and Dashboards have been linked together as if they were interchangeable. However, although both visually display critical information, the difference is in the format: Scoreboards can open the quality of an operation while dashboards provide calculated direction. A balanced scoreboard has what they called a “prescriptive” format. It should always contain these components (Active Strategy) ...
(1) Perspectives – groupings of high level strategic areas.
(2) Objectives – verb-noun phrases pulled from a strategy plan.
(3) Measures – also called Metric or Key Performance Indicators (KPIs).
(4) Spotlight Indicators – red, yellow, or green symbols that provide an at-a-glance view of a measure’s performance.
Each of these sections ensures that a Balanced Scorecard is essentially connected to the businesses critical strategic needs.
The design of a dashboard is more loosely defined. Dashboards are usually a series of graphics, charts, gauges and other visual indicators that can be monitored and interpreted. Even when there is a strategic link, on a dashboard, it may not be noticed as such since objectives are not normally present on dashboards. However, dashboards can be customized to link their graphs and charts to strategic objectives." [Dashboard (business). Wikipedia]
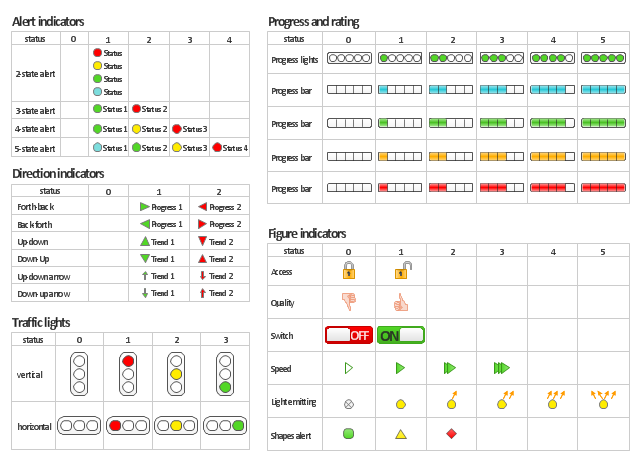
The vector stencils library "Status indicators" contains 41 visual status indicators for creating the business performance dashboards using the ConceptDraw PRO diagramming and vector drawing software.
Each status indicator can visualize one of 2-6 information states and have a caption.
Status indicators allow you quickly estimate, where your immediate decision and action is critical.
The example "Design elements - Status indicators" is included in the Status Dashboard solution from the area "What is a Dashboard" of ConceptDraw Solution Park.
Balanced Scoreboards and Dashboards have been linked together as if they were interchangeable. However, although both visually display critical information, the difference is in the format: Scoreboards can open the quality of an operation while dashboards provide calculated direction. A balanced scoreboard has what they called a “prescriptive” format. It should always contain these components (Active Strategy) ...
(1) Perspectives – groupings of high level strategic areas.
(2) Objectives – verb-noun phrases pulled from a strategy plan.
(3) Measures – also called Metric or Key Performance Indicators (KPIs).
(4) Spotlight Indicators – red, yellow, or green symbols that provide an at-a-glance view of a measure’s performance.
Each of these sections ensures that a Balanced Scorecard is essentially connected to the businesses critical strategic needs.
The design of a dashboard is more loosely defined. Dashboards are usually a series of graphics, charts, gauges and other visual indicators that can be monitored and interpreted. Even when there is a strategic link, on a dashboard, it may not be noticed as such since objectives are not normally present on dashboards. However, dashboards can be customized to link their graphs and charts to strategic objectives." [Dashboard (business). Wikipedia]
The vector stencils library "Status indicators" contains 41 visual status indicators for creating the business performance dashboards using the ConceptDraw PRO diagramming and vector drawing software.
Each status indicator can visualize one of 2-6 information states and have a caption.
Status indicators allow you quickly estimate, where your immediate decision and action is critical.
The example "Design elements - Status indicators" is included in the Status Dashboard solution from the area "What is a Dashboard" of ConceptDraw Solution Park.
Visual status indicators
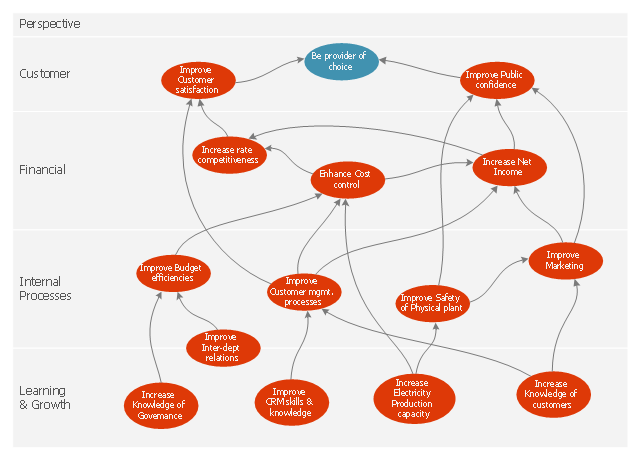
This marketing diagram sample depicts balanced scorecard strategy map.
It was redesigned from the Wikimedia Commons file: Strategy map.JPG. [commons.wikimedia.org/ wiki/ File:Strategy_ map.JPG]
"A strategy map is a diagram that is used to document the primary strategic goals being pursued by an organization or management team. It is an element of the documentation associated with the Balanced Scorecard...
Strategy maps show:
(1) Each objective as text appearing within a shape (usually an oval or rectangle).
(2) Relatively few objectives (usually less than 20).
(3) Objectives are arrayed across two or more horizontal bands on the strategy map, with each band representing a 'perspective'.
(4) Broad causal relationships between objectives shown with arrows that either join objectives together, or placed in a way not linked with specific objectives but to provide general euphemistic indications of where causality lies." [Strategy map. Wikipedia]
The marketing diagram example "Balanced scorecard strategy map" was created using the ConceptDraw PRO diagramming and vector drawing software extended with the Marketing Diagrams solution from the Marketing area of ConceptDraw Solution Park.
Marketing diagram
Market Chart

KPI Dashboard

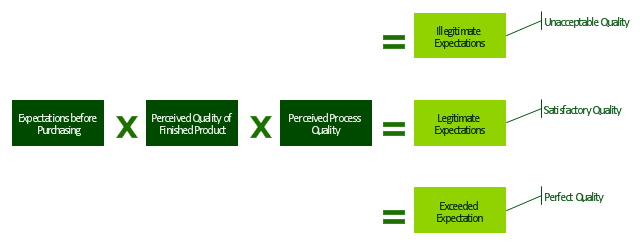
"Customer satisfaction is a term frequently used in marketing. It is a measure of how products and services supplied by a company meet or surpass customer expectation. Customer satisfaction is defined as "the number of customers, or percentage of total customers, whose reported experience with a firm, its products, or its services (ratings) exceeds specified satisfaction goals." ...
It is seen as a key performance indicator within business and is often part of a Balanced Scorecard. In a competitive marketplace where businesses compete for customers, customer satisfaction is seen as a key differentiator and increasingly has become a key element of business strategy." [Customer satisfaction. Wikipedia]
The block diagram example "Sources of customer satisfaction" was created using the ConceptDraw PRO diagramming and vector drawing software extended with the Block Diagrams solution from the area "What is a Diagram" of ConceptDraw Solution Park.
Block diagram
 Marketing Diagrams
Marketing Diagrams solution extends ConceptDraw DIAGRAM diagramming software with abundance of samples, templates and vector design elements intended for easy graphical visualization and drawing different types of Marketing diagrams and graphs, including Branding Strategies Diagram, Five Forces Model Diagram, Decision Tree Diagram, Puzzle Diagram, Step Diagram, Process Chart, Strategy Map, Funnel Diagram, Value Chain Diagram, Ladder of Customer Loyalty Diagram, Leaky Bucket Diagram, Promotional Mix Diagram, Service-Goods Continuum Diagram, Six Markets Model Diagram, Sources of Customer Satisfaction Diagram, etc. Analyze effectively the marketing activity of your company and apply the optimal marketing methods with ConceptDraw DIAGRAM software.
Dashboard

Marketing Organization Chart

SWOT Analysis Software: Comprehensive Guide

Pie Donut Chart. Pie Chart Examples

Remote Projects in Corporate Strategy


 Business and Finance
Use Business and Finance solution to make professional-looking documents, presentations and websites, business, finance, advertising, and project management illustrations, or any designs that requires clipart of currency, office, business, advertising, management, marketing, people, time, post, contacts, collaboration, etc.
Pyramid Chart Examples

This financila dashboard example was drawn on the base of the Enterprise dashboard from the Mecklenburg County Government website.
[charmeck.org/ mecklenburg/ county/ CountyManagersOffice/ OMB/ dashboards/ Pages/ Enterprise.aspx]
"In management information systems, a dashboard is "an easy to read, often single page, real-time user interface, showing a graphical presentation of the current status (snapshot) and historical trends of an organization’s key performance indicators to enable instantaneous and informed decisions to be made at a glance."
For example, a manufacturing dashboard may show key performance indicators related to productivity such as number of parts manufactured, or number of failed quality inspections per hour. Similarly, a human resources dashboard may show KPIs related to staff recruitment, retention and composition, for example number of open positions, or average days or cost per recruitment.
Types of dashboards.
Dashboard of Sustainability screen shot illustrating example dashboard layout.
Digital dashboards may be laid out to track the flows inherent in the business processes that they monitor. Graphically, users may see the high-level processes and then drill down into low level data. This level of detail is often buried deep within the corporate enterprise and otherwise unavailable to the senior executives.
Three main types of digital dashboard dominate the market today: stand alone software applications, web-browser based applications, and desktop applications also known as desktop widgets. The last are driven by a widget engine.
Specialized dashboards may track all corporate functions. Examples include human resources, recruiting, sales, operations, security, information technology, project management, customer relationship management and many more departmental dashboards.
Digital dashboard projects involve business units as the driver and the information technology department as the enabler. The success of digital dashboard projects often depends on the metrics that were chosen for monitoring. Key performance indicators, balanced scorecards, and sales performance figures are some of the content appropriate on business dashboards." [Dashboard (management information systems). Wikipedia]
The example "Enterprise dashboard" was created using the ConceptDraw PRO diagramming and vector drawing software extended with the Composition Dashboard solution from the area "What is a Dashboard" of ConceptDraw Solution Park.
Financial dashboard


Organizational Structure Types

Create a Basic Presentation Quickly

Accounts Payable Flowchart

Strategy Map

- Balanced Scorecard Software | Create Your Own Scorecard
- Balanced Scorecard Software | Marketing Diagrams | Status ...
- Balanced Scorecard Software | Scorecard Design Template
- Balanced Scorecard Software | KPI Dashboard | Dashboard ...
- Balanced Scorecard Software | Design elements - Meter indicators ...
- Balanced Scorecard Software | Design elements - Status indicators ...
- Balanced Scorecard Software | Marketing Diagrams | Status ...
- Balanced Scorecard Software | Marketing Diagrams | Market Chart ...
- Balanced Scorecard Software | Market Chart | Enterprise dashboard ...