
Example 1. Market Chart - Diagram Leaky Bucket
Marketing Diagrams Solution is ideal for drawing the Market Chart in minutes. You need to follow a few steps for this:
- create the new document,
- drag the required shapes from the Marketing Diagrams library included in Marketing Diagrams Solution and arrange them,
- type the text.

Example 2. Marketing Diagrams Library Design Elements
Marketing Diagrams library contains 11 ready-to-use vector objects. All they are vector objects, you can resize them without loss of quality, change their color to make your market chart more interesting, bright and attractive.

Example 3. Market Chart - Balanced Scorecard Strategy Map
The Market Chart samples you see on this page were created in ConceptDraw DIAGRAM using the tools of the Marketing Diagrams Solution for ConceptDraw DIAGRAM Solution Park. Each of these samples successfully demonstrates solution's capabilities and professional results you can achieve. An experienced user spent 5-10 minutes creating every of them.
Use the Marketing Diagrams Solution for ConceptDraw DIAGRAM software to create your own professionally designed marketing charts, marketing diagrams, market chart quick, easy and effective, and then successfully use them in work or education activity.
All source documents are vector graphic documents. They are available for reviewing, modifying, or converting to a variety of formats (PDF file, MS PowerPoint, MS Visio, and many other graphic formats) from the ConceptDraw STORE. The Marketing Diagrams Solution is available for all ConceptDraw DIAGRAM or later users.
NINE RELATED HOW TO's:
Need to draw a diagram, process chart, flowchart, organizational chart, graphic design? ConceptDraw can help you to make professional graphic documents quickly.
Picture: Best Diagramming
Related Solution:
If you need to pull together a quick marketing drawing, you'll find elements, samples, templates and libraries with vector clip art for drawing the Marketing Illustrations.
These symbols and signs you can use in your design for Strategic Marketing, Graphic Design, Inbound and Content Marketing, Social Media, Lead Generation, Email Marketing and Automation, CRM implementation and Integration and more.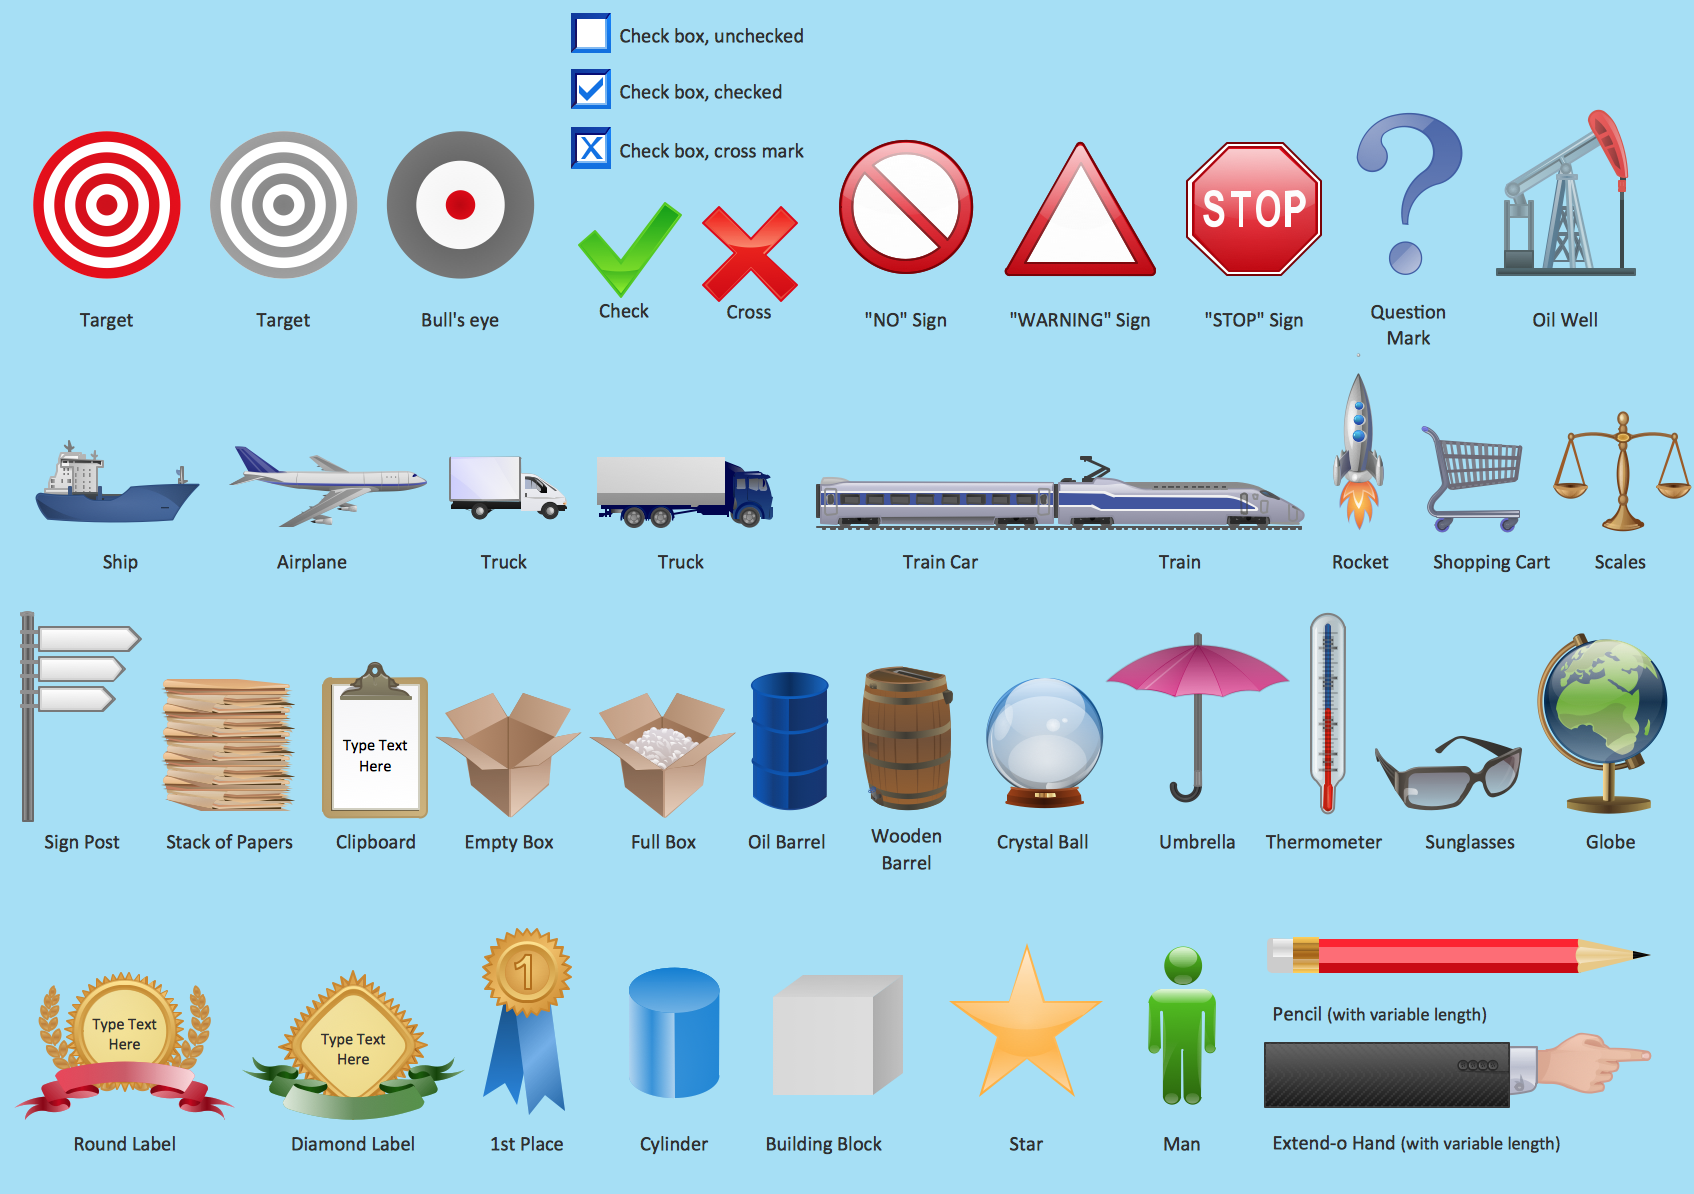
Picture: Marketing - Design Elements
Related Solution:
To create flowcharts in MS Word, programs designed specifically for the purpose of creating flowcharts are particularly well-suited to the task.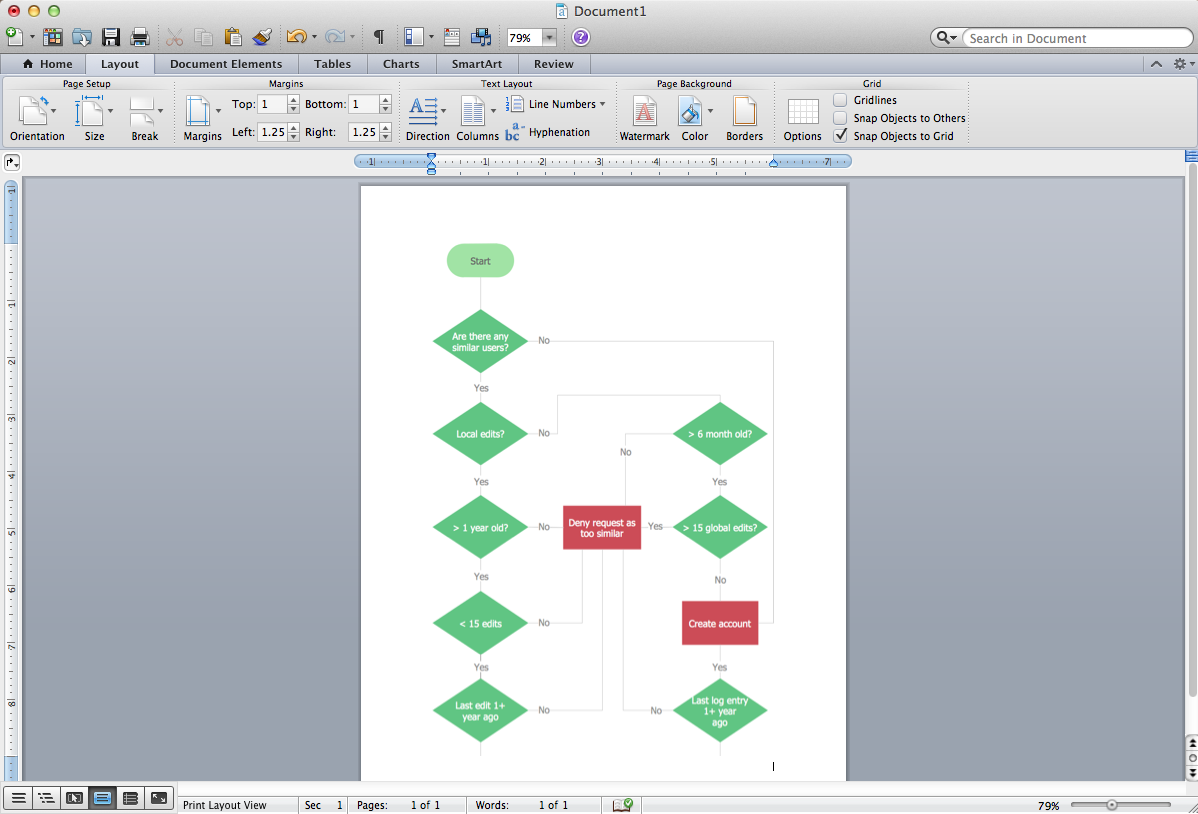
Picture: Flowcharts in Word
Related Solution:
An organizational chart is a diagram that shows the structure of an organization and the relationships of its parts. ConceptDraw DIAGRAM extended with Organizational Charts Solution from the Management Area is powerful Organizational Chart Software.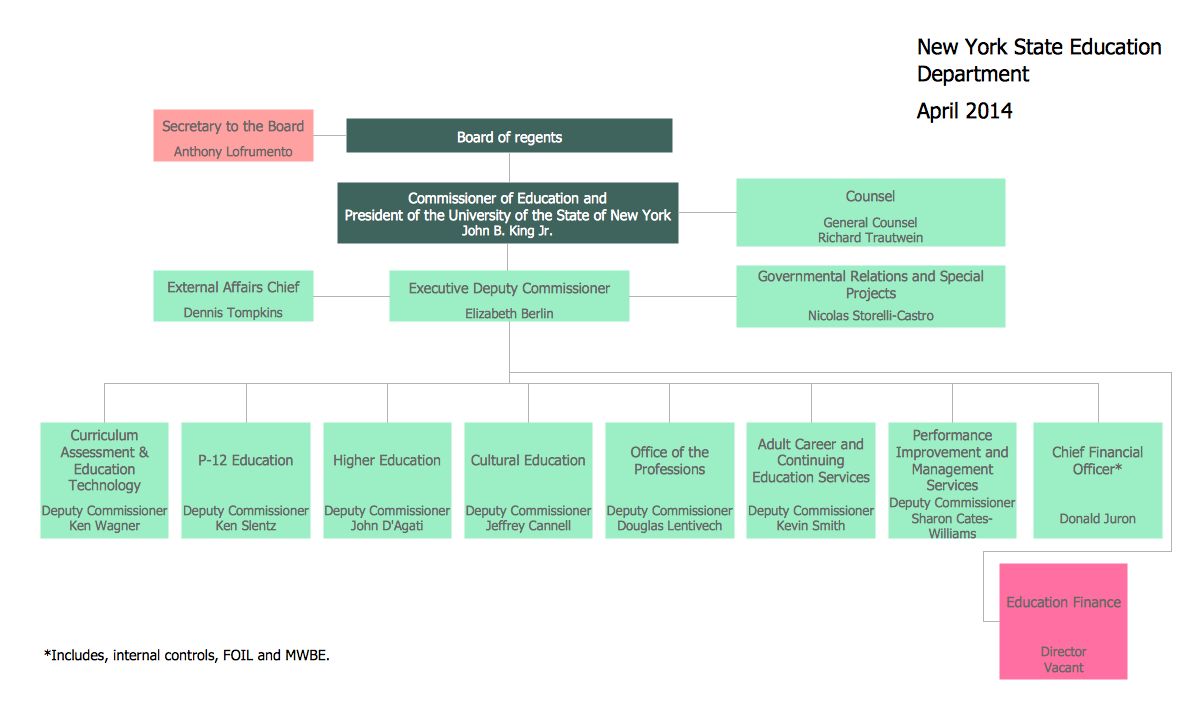
Picture: Organizational Chart
Related Solution:
This sample was created in ConceptDraw DIAGRAM diagramming and vector drawing software using the Line Graphs Solution from Graphs and Charts area of ConceptDraw Solution Park.
This sample shows the Line Chart of annual percentage change. The Line Chart allows you to clearly see the changes of data over the time.
Picture: Line Chart Template for Word
Related Solution:
pyramida
Picture: Pyramid Diagram
Related Solution:
Pyramid diagram is a convenient way of representing data hierarchical structure and visualization relationships between hierarchy levels. You need create the diagram of a pyramid? ConceptDraw diagramming and vector drawing software supplied with Pyramid Diagrams Solution from the Marketing Area of ConceptDraw Solution Park is the best tool for drawing attractive and successful diagram of a pyramid.
Picture: Diagram of a Pyramid
Related Solution:
Electrical plan is a document that is developed during the first stage of the building design. This scheme is composed of conventional images or symbols of components that operate by means of electric energy. To simplify the creation of these schemes you can use house electrical plan software, which will not require a long additional training to understand how to use it. You only need to install the necessary software ant it’s libraries and you’ll have one less problem during the building projection.
Any building contains a number of electrical systems, including switches, fixtures, outlets and other lightening equipment. All these should be depicted in a building electrical plans and included to general building documentation. This home electrical plan displays electrical and telecommunication devices placed to a home floor plan. On the plan, each electrical device is referenced with the proper symbol. Electrical symbols are used for universal recognition of the building plan by different persons who will be working on the construction. Not all possible electric symbols used on a certain plan, so the symbols used in the current home plan are included to a legend. The electrical home plan may be added as a separate document to a complete set of building plans.
Picture: How To use House Electrical Plan Software
Related Solution:
An example of marketing analysis diagram, can be used to analyse product market and define marketing strategy.
Picture: Marketing Analysis Diagram
Related Solution:

