Balanced Scorecard Software

"Dashboards give signs about a business letting the user know something is wrong or something is right. ...
Balanced Scoreboards and Dashboards have been linked together as if they were interchangeable. However, although both visually display critical information, the difference is in the format: Scoreboards can open the quality of an operation while dashboards provide calculated direction. A balanced scoreboard has what they called a “prescriptive” format. It should always contain these components (Active Strategy) ...
(1) Perspectives – groupings of high level strategic areas.
(2) Objectives – verb-noun phrases pulled from a strategy plan.
(3) Measures – also called Metric or Key Performance Indicators (KPIs).
(4) Spotlight Indicators – red, yellow, or green symbols that provide an at-a-glance view of a measure’s performance.
Each of these sections ensures that a Balanced Scorecard is essentially connected to the businesses critical strategic needs.
The design of a dashboard is more loosely defined. Dashboards are usually a series of graphics, charts, gauges and other visual indicators that can be monitored and interpreted. Even when there is a strategic link, on a dashboard, it may not be noticed as such since objectives are not normally present on dashboards. However, dashboards can be customized to link their graphs and charts to strategic objectives." [Dashboard (business). Wikipedia]
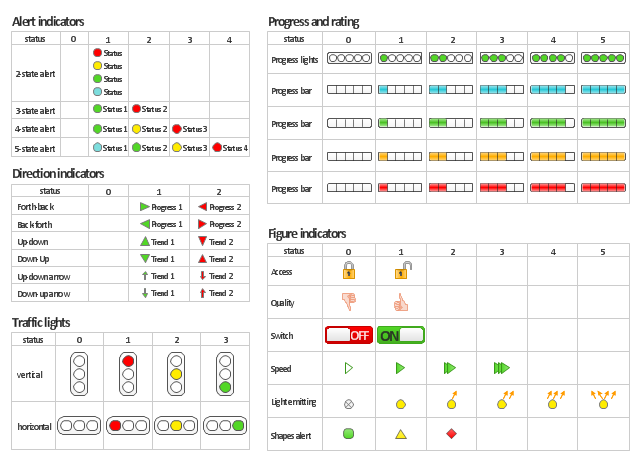
The vector stencils library "Status indicators" contains 41 visual status indicators for creating the business performance dashboards using the ConceptDraw PRO diagramming and vector drawing software.
Each status indicator can visualize one of 2-6 information states and have a caption.
Status indicators allow you quickly estimate, where your immediate decision and action is critical.
The example "Design elements - Status indicators" is included in the Status Dashboard solution from the area "What is a Dashboard" of ConceptDraw Solution Park.
Balanced Scoreboards and Dashboards have been linked together as if they were interchangeable. However, although both visually display critical information, the difference is in the format: Scoreboards can open the quality of an operation while dashboards provide calculated direction. A balanced scoreboard has what they called a “prescriptive” format. It should always contain these components (Active Strategy) ...
(1) Perspectives – groupings of high level strategic areas.
(2) Objectives – verb-noun phrases pulled from a strategy plan.
(3) Measures – also called Metric or Key Performance Indicators (KPIs).
(4) Spotlight Indicators – red, yellow, or green symbols that provide an at-a-glance view of a measure’s performance.
Each of these sections ensures that a Balanced Scorecard is essentially connected to the businesses critical strategic needs.
The design of a dashboard is more loosely defined. Dashboards are usually a series of graphics, charts, gauges and other visual indicators that can be monitored and interpreted. Even when there is a strategic link, on a dashboard, it may not be noticed as such since objectives are not normally present on dashboards. However, dashboards can be customized to link their graphs and charts to strategic objectives." [Dashboard (business). Wikipedia]
The vector stencils library "Status indicators" contains 41 visual status indicators for creating the business performance dashboards using the ConceptDraw PRO diagramming and vector drawing software.
Each status indicator can visualize one of 2-6 information states and have a caption.
Status indicators allow you quickly estimate, where your immediate decision and action is critical.
The example "Design elements - Status indicators" is included in the Status Dashboard solution from the area "What is a Dashboard" of ConceptDraw Solution Park.
Visual status indicators
 Marketing Diagrams
This solution extends ConceptDraw PRO with samples, templates and library of design elements for drawing the marketing diagrams.
 Project Exchange
This solution extends ConceptDraw PROJECT and ConceptDraw MINDMAP software with the ability to import and export project data.
Competitor Analysis

- Design elements - Status indicators | Design elements - Meter ...
- Status Dashboard | ConceptDraw Solution Park | Balanced ...
- Balanced Scorecard Software | Market Chart | Marketing Diagrams ...
- Balanced Scorecard Software | Market Chart | Marketing Diagrams ...
- Status Dashboard Ppt Download
- Balanced Scorecard Software | Market Chart | Enterprise dashboard ...
- Balanced Scorecard Software | Market Chart | Marketing Diagrams ...
- Balanced Scorecard Software | Balanced scorecard strategy map ...
- Balanced Scorecard Software | Market Chart | Marketing Diagrams ...
- Balanced Scorecard Software | Market Chart | Marketing Diagrams ...
- Balanced Scorecard Software | Competitor Analysis | Marketing ...
- Design elements - Meter indicators | Information Security Scorecard
- Design elements - Status indicators | Status Dashboard | iPhone OS ...
- Marketing Diagrams | ícon Balanced Scorecard
- Dashboard | Balanced Scorecard Software | KPI Dashboard ...
- Status Dashboard | Dashboard | Meter Dashboard | Free ...
- Status Dashboard | Project task status dashboard - Template ...
- Status Dashboard | Project task status dashboard - Template ...
- Marketing Diagrams | Balanced Scorecard Online Free
- Balanced Scorecard Software | Design elements - Meter indicators ...