HelpDesk
How to Edit Drawing Using Shadows in ConceptDraw PRO

Diagrams Mean Nothing

Working with Time

The vector stencils library "IVR people" contains 9 interactive voice response (IVR) people icons. Use it to design your IVR diagrams with ConceptDraw PRO diagramming and vector drawing software.
"Icon design is the process of designing a graphic symbol that represents some real, fantasy or abstract motive, entity or action. ... Icon designs can be simple, with flat two-dimensional drawing or a black silhouette, or complex, presenting a combination of graphic design elements such as one or more linear and radial color gradients, projected shadows, contour shades, and three-dimensional perspective effects." [Icon design. Wikipedia]
The IVR diagram symbols example "Design elements - IVR people" is included in the Interactive Voice Response Diagrams solution from the Computer and Networks area of ConceptDraw Solution Park.
Interactive voice response icons
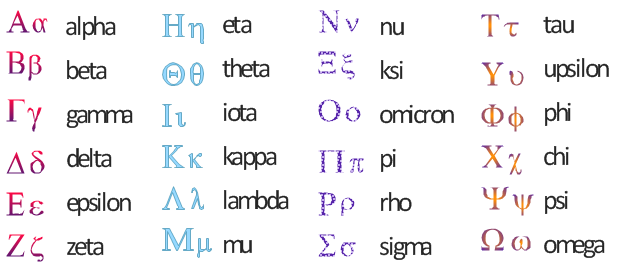
The vector stencils library "Greek letters" contains 87 symbols for creation of stylized text with special effects as gradient fill, shadows, textures, ornaments, outlines, character rotation, "bend" and "stretch" not available through the text formatting.
You can use it to design your own art titles and typography elements for your illustrations, presentation slides, infographics and diagrams using the ConceptDraw PRO diagramming and vector drawing software.
The vector typography example "Design elements - Greek letters" is included in the Artwork solution from the Illustration area of ConceptDraw Solution Park.
Vector typography
HelpDesk
How to Create an Enterprise Architecture Diagram in ConceptDraw PRO

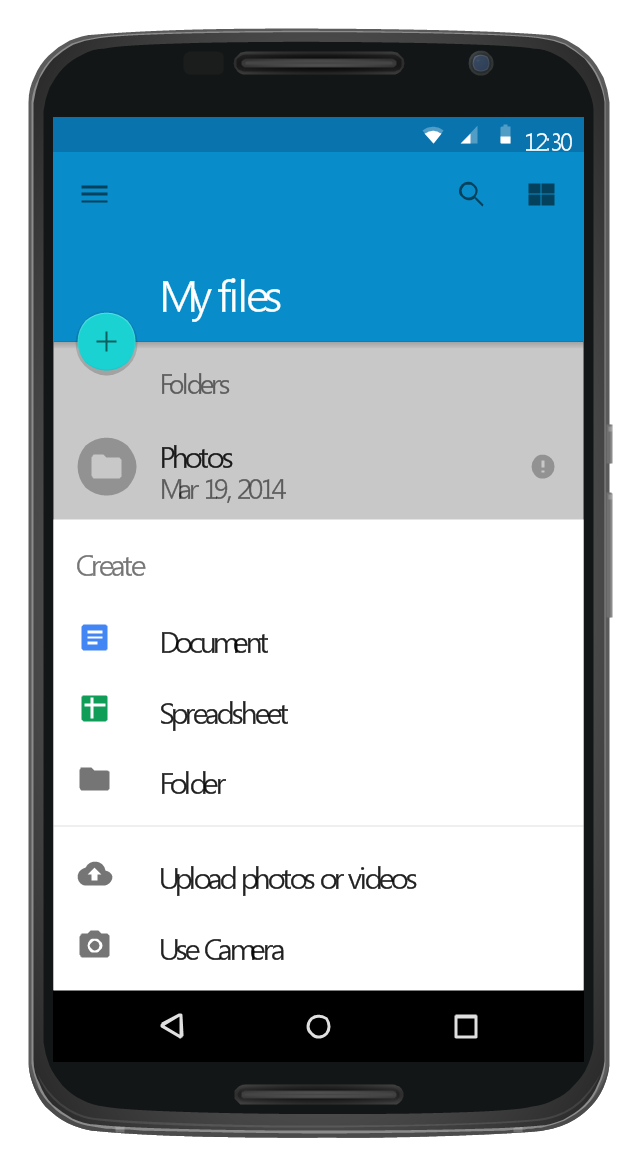
This Android 5 UI design example shows My Files screen of Google Nexus 6 smartphone.
The user interface design example "Android 5.0 - List-style bottom sheet" was created using the ConceptDraw PRO diagramming and vector drawing software extended with the "Android user interface" solution from the "Software Development" area of ConceptDraw Solution Park.
The user interface design example "Android 5.0 - List-style bottom sheet" was created using the ConceptDraw PRO diagramming and vector drawing software extended with the "Android user interface" solution from the "Software Development" area of ConceptDraw Solution Park.
List-style bottom sheet UI
Working with Space

Coloring Graphs

Tables’ Beauty

HelpDesk
How to Draw a Block Diagram in ConceptDraw PRO

HelpDesk
How to Create a Concept Map in ConceptDraw PRO

HelpDesk
How to Create Education Infographics

HelpDesk
How to Create a Stakeholder Onion Diagram Using ConceptDraw PRO

HelpDesk
How to Draw a Circular Arrows Diagram Using ConceptDraw PRO

- How to Edit Drawing Using Shadows in ConceptDraw PRO | How to ...
- How to Edit Drawing Using Shadows in ConceptDraw PRO | How to ...
- How to Edit Drawing Using Shadows in ConceptDraw PRO | Sadow ...
- How to Edit Drawing Using Shadows in ConceptDraw PRO | How to ...
- How to Add a Self-Drawn Object to any Library | How to Edit ...
- Design elements - ABC | How to Create a Typography Infographic ...
- Basketball Plays Diagrams | Basketball | Bubble diagrams in ...
- Soccer (Football) Field Templates | Soccer (Football) Tactics ...
- Interior Design Office Layout Plan Design Element | Cafe and ...
- Design elements - ABC | Artwork | Abc Letters
- What is IVR? | Interactive Voice Response System | IVR Systems | Ivr ...
- The Best Choice for Creating Diagram | Education | Basic ...
- Design elements - Greek letters | Education | Scientific Symbols ...
- Design elements - Greek letters | Artwork | How to Draw a Natural ...
- Cisco People. Cisco icons, shapes, stencils and symbols | Design ...
- Design elements - Astronomical symbols | Design elements - Greek ...
- Typography Art | How to Create a Typography Infographic Using ...
- Design elements - Greek letters | ABC - Vector stencils library ...
- Export from ConceptDraw PRO Document to a Graphic File | Cisco ...
- ABC - Vector stencils library | Design elements - Callouts | Design ...