Working with Time
In the previous article we have learned how to use space in technical illustrations and diagrams. Now we will discuss time. Time is almost always present on charts, graphs and flowcharts:

In this example we see a booking process deployment from left to right. This is a common and intuitive time direction. Sometimes the action in flowcharts goes in two directions:

This always adversely affects readability, but sometimes one cannot avoid it. In thiscase, we need to mark a major time direction:

While on diagrams, time may be presented implicitly; however, on graphs with a timescale it is the key player:

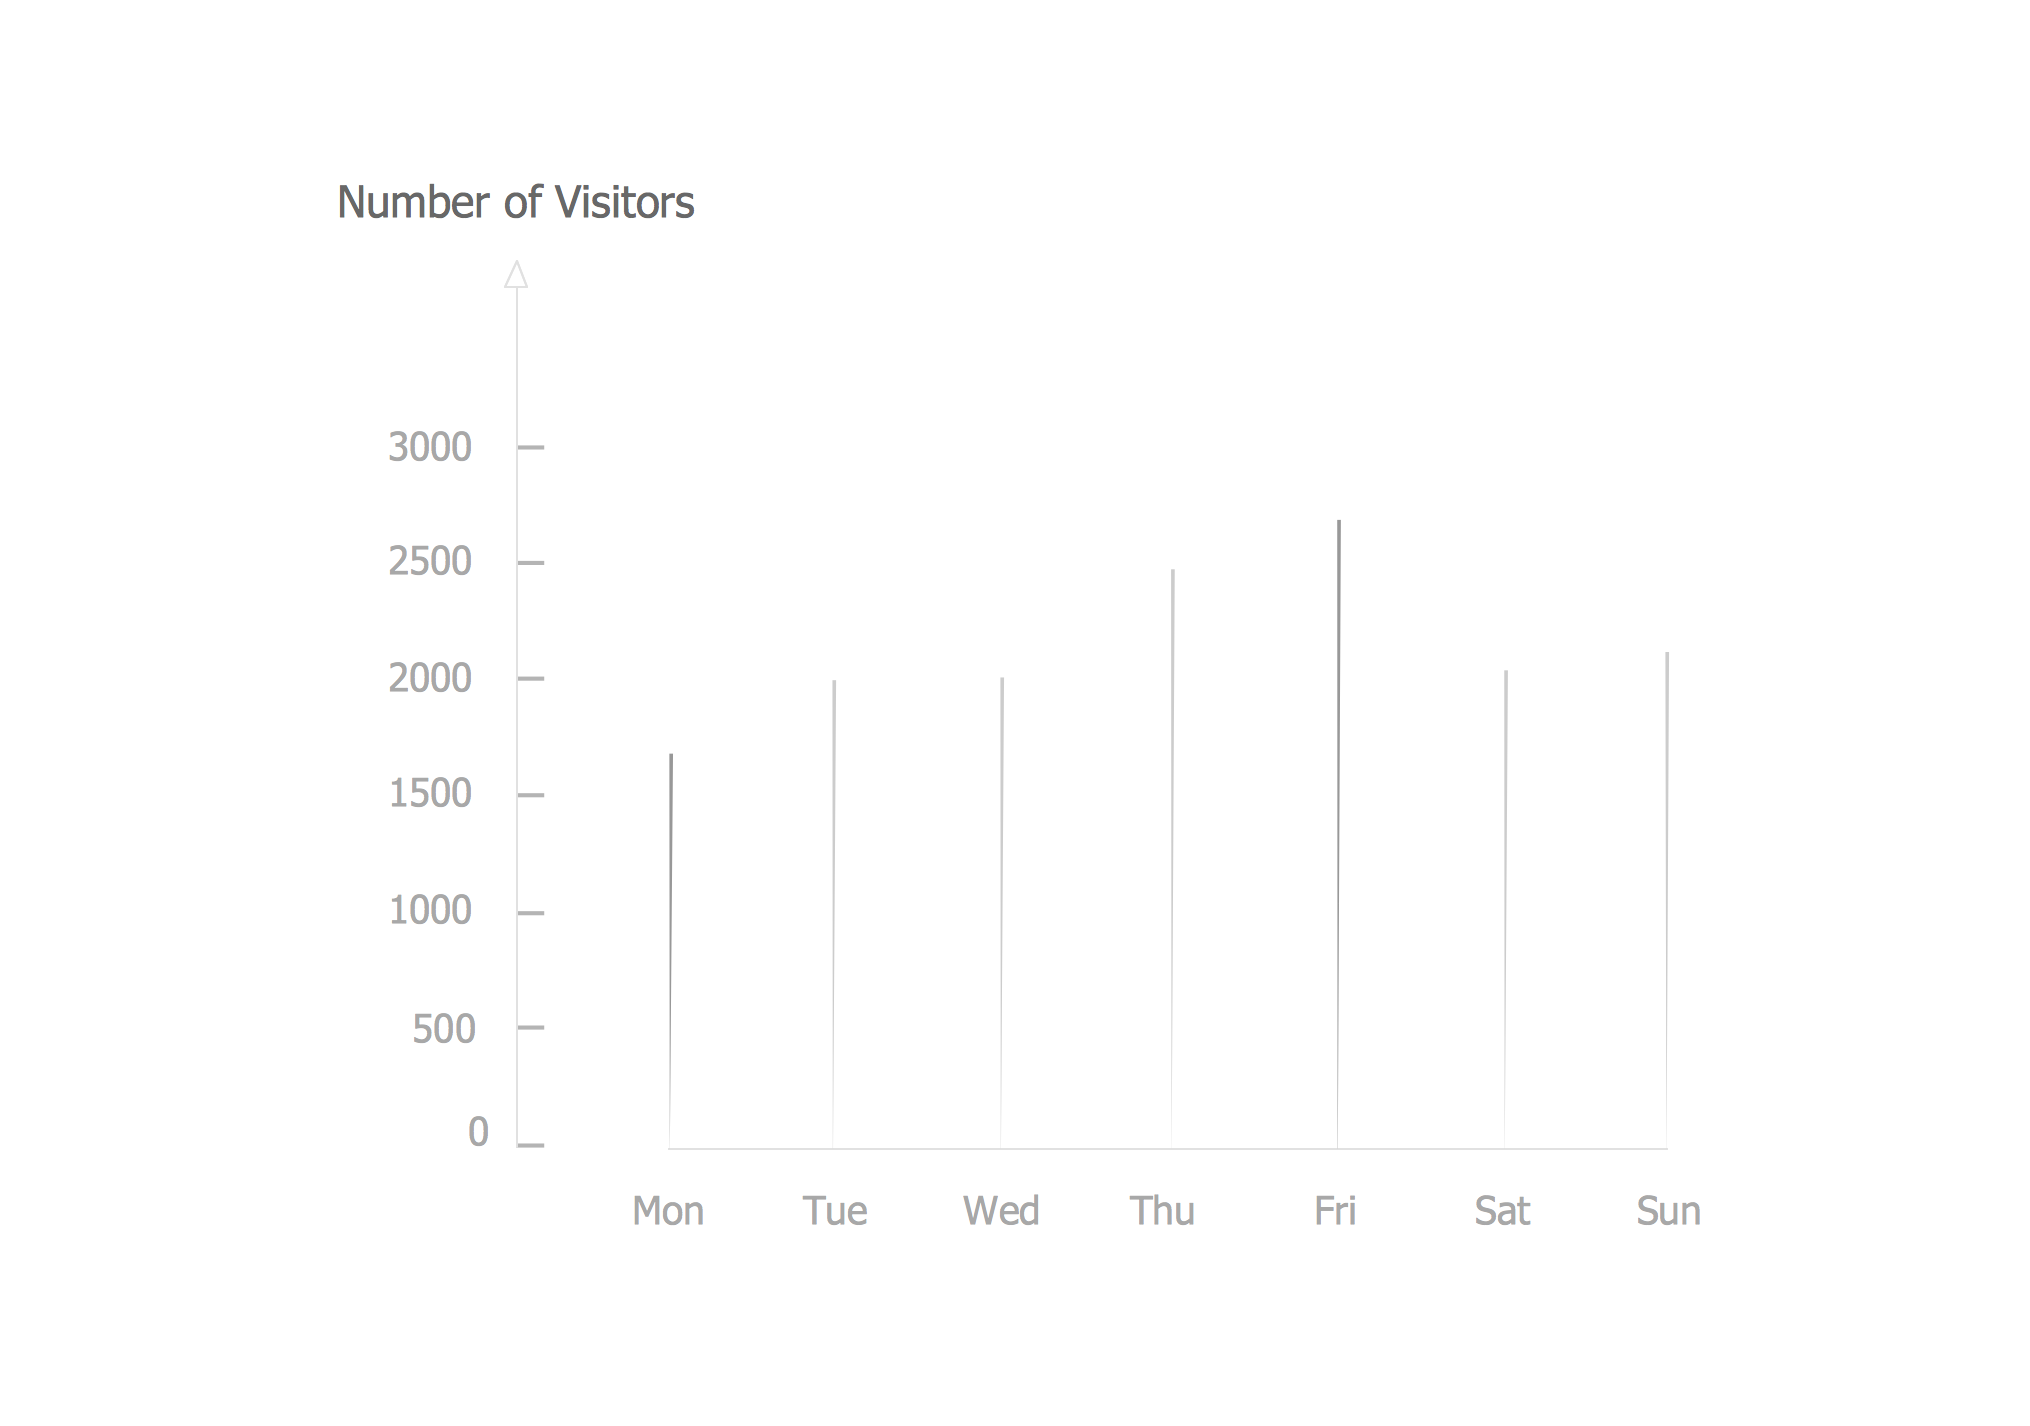
Here we can see how the website’s capacity may vary during a week. It’s important to understand the difference between discrete and continuous data. Let’s say human’s height is a continuous change: if at age 10 the height was 130 cm and at age 20 – 180 cm, then we can confidently say that it was about 170 cm in the teenage period.
The situation is fundamentally different about a website traffic data: if on a Monday’s morning there are 1600 visitors, and on Tuesday – 2000 visitors, it doesn’t mean that on the night of Tuesday the website was visited by 1750 people.

That’s why it is impossible to use data smoothing for continuous data. Make sure you show the points which represent the measured data directly:

Yet, this doesn’t exclude the false information, which this graph represents: the lines between dots are not truly informative. Let’s get rid of them:

Now we have another problem: the graphs, especially those with large bulk of data, are almost unreadable. Eyes just skip over the dots and can’t catch a thing. And the main point is that you can’t understand where minimum and maximum values are. There is a way to solve both issues:
This graph still has its drawbacks, like excess of information. In the next article, we will discuss how to deal with it.
