 PM Agile
This solution extends ConceptDraw PRO software. All Agile meetings and documents are powered by mission adapted mind map templates, specially tuned for collaborative work.
 Scrum Workflow
The Scrum Workflow Solution extends the capabilities of ConceptDraw PRO 10 with a large collection of professionally-designed samples and a selection of ready-to-use scrum design elements: scrum diagrams and arrows, scrum icons of people, artifacts, workflow, workspace and other colorful scrum clipart, and also scrum charts.
HelpDesk
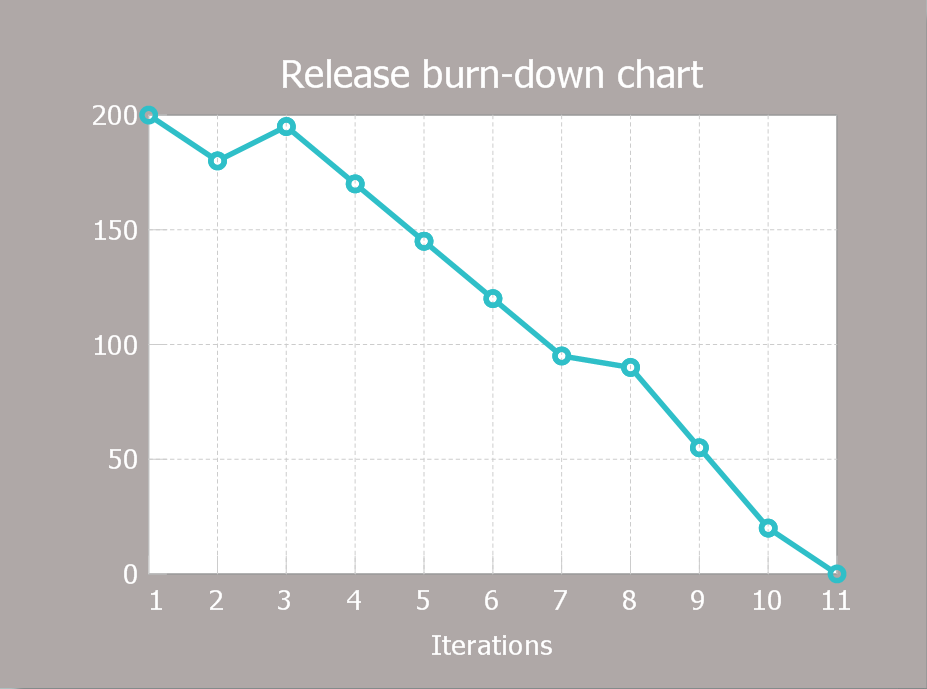
How to Create a Release Burn-Down Chart Using ConceptDraw PRO
The Agile methodology provides project teams the ability to quickly adapt the project to the current situation and thus achieve maximum productivity. According the Scrum method the steps needed to fulfill the project goal breaks down by using short sprints or iterations. The iterations together with an extensive collaboration can increase productivity by better understanding the entire flow of a project. A release burn-down chart is used to track a progress on a Scrum project. The ConceptDraw Scrum Workflow Solution makes it easy for Agile project team to build any professional Scrum diagram such as a Release velocity chart, Release burn-down chart, Sprint burn-down chart, or a Team velocity chart.
 ConceptDraw Solution Park
ConceptDraw Solution Park collects graphic extensions, examples and learning materials
 Organizational Charts
Organizational Charts solution extends ConceptDraw PRO software with samples, templates and library of vector stencils for drawing the org charts.
 Pie Charts
Pie Charts are extensively used in statistics and business for explaining data and work results, in mass media for comparison (i.e. to visualize the percentage for the parts of one total), and in many other fields. The Pie Charts solution for ConceptDraw PRO v10 offers powerful drawing tools, varied templates, samples, and a library of vector stencils for simple construction and design of Pie Charts, Donut Chart, and Pie Graph Worksheets.
 Area Charts
Area Charts are used to display the cumulative totals over time using numbers or percentages; or to show trends over time among related attributes. The Area Chart is effective when comparing two or more quantities. Each series of data is typically represented with a different color, the use of color transparency in an object’s transparency shows overlapped areas and smaller areas hidden behind larger areas.
- Conceptdraw.com: Mind Map Software, Drawing Tools | Project ...
- PM Agile | SSADM Diagram | Organizational Charts with ...
- PM Agile | Scrum Workflow | Scrum | Scrum Management
- Agile Methodology | PM Agile | Scrum Workflow | What Is Agile ...
- Workflow Diagrams | Scrum workflow | How to Draw a Natural ...
- Chart Audits. Chart Auditor | Pyramid Diagram and Pyramid Chart ...
- UML Diagram | Scrum | Draw Two Diagram Of A Artifact In The Market
- Flow Chart Online | Contoh Flowchart | Online Diagram Tool | Make ...
- Software Work Flow Process in Project Management with Diagram ...
- PM Agile | Workflow diagram - Weather forecast | Velocity Chart
- Product Ownership Flowchart In Scrum
- PM Agile | Program Evaluation and Review Technique (PERT) with ...
- PM Easy | Gantt Chart Software | How To Plan and Implement ...
- Picture graph template | Design elements - Picture graphs | Graphs ...
- PM Agile | ConceptDraw Solution Park | Burn Down Chart
- Basic Diagramming | PM Dashboards | Program to Make Flow Chart ...
- Marketing | PM Agile | Comparison Dashboard | Comparison Table ...
- PM Agile | SWOT Analysis | SWOT analysis Software & Template for ...
- Program Evaluation and Review Technique (PERT) with ...
- How to Create an IDEF0 Diagram for an Application Development ...
