Sales Process FlowchartFlowchart Examples

This flowchart example was created on the base of land sales process diagram from the Property management webpage of the VicRoads website.
[www.vicroads.vic.gov.au/ planning-and-projects/ property-services/ property-management]
"VicRoads or the Roads Corporation of Victoria is a statutory corporation which is the state road and traffic authority in the state of Victoria, Australia. It is responsible for maintenance and construction of the state arterial road network, as well as driver licensing and vehicle registration. VicRoads has broad responsibility for road safety policy and research. It is also responsible for regulating the accident towing industry in Victoria." [VicRoads. Wikipedia]
"Sales Process.
Once it has been established with the relevant VicRoads Regions/ Projects and other business areas that properties are identified as surplus to VicRoads’ operational needs, they are incorporated in the VicRoads annual sales program.
Following approval: relevant VicRoads Regional Manager and the VicRoads Chief Executive (and in some circumstances Minster for Public Transport and Roads) must approve all land deemed surplus and available for disposal.
The method of sale is then determined and consultant advice is sought:
(1) Planning.
(2) Valuer General Victoria (Valuer General’s office must provide a valuation for all sales).
(3) Government Land Monitor (Land Monitor approval is sought if the value exceeds $750,000).
(4) Environmental.
(5) Local Council." [www.vicroads.vic.gov.au/ planning-and-projects/ property-services/ property-management]
The example "Land sales process flowchart" was created using the ConceptDraw PRO diagramming and vector drawing software extended with the Sales Flowcharts solution from the Marketing area of ConceptDraw Solution Park.
Sales process chart

 Sales Flowcharts
The Sales Flowcharts solution lets you create and display sales process maps, sales process workflows, sales steps, the sales process, and anything else involving sales process management.
Cross-Functional Flowchart Basics

Sales Process

Sales Process Flowcharts

Work Order Process Flowchart. Business Process Mapping Examples

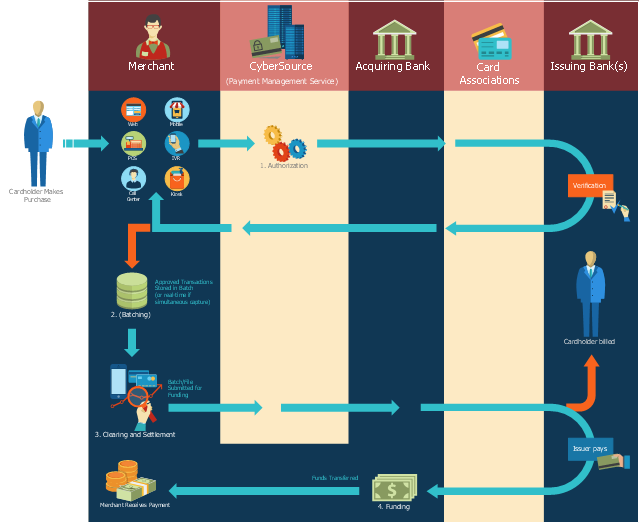
This payment process flowchart example was created on the base of the diagram of payment process using Global Payment Processing Services from the U.S. Securities and Exchange Commission website.
"Global Payment Processing Services. CyberSource Advanced enables merchants to accept payments made by all major credit and debit cards including American Express®, Discover®, Diners Club International®, JCB, MasterCard®, and Visa® cards. Our customers can also accept payment by corporate procurement cards, electronic checks, PayPal® Express Checkout, and the Bill Me Later® service. Merchants that have business models based on subscriptions can utilize the CyberSource recurring billing service with automated account updating services. For merchants selling internationally, we support direct debit, and bank transfers, as well as regional card brands such as Carte Bleue, Carta Si, Dankort, Laser, Solo, and Visa Electron. We provide these services for online, call center, kiosk, integrated voice response (“IVR”), and IP-enabled point of sale (“POS”) transactions."
[www.sec.gov/ Archives/ edgar/ data/ 934280/ 000119312510042764/ d10k.htm]
The flowchart example "Global Payment Solutions" was created using the ConceptDraw PRO diagramming and vector drawing software extended with the Sales Flowcharts solution from the Marketing area of ConceptDraw Solution Park.
Payment process flowchart
Sales Process Flowchart Symbols

How to Make an Accounting Process Flowchart

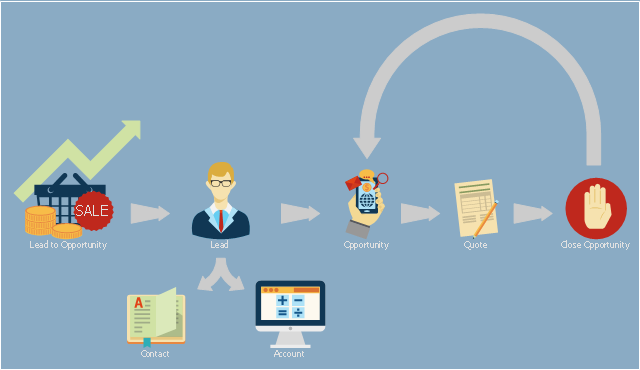
This presales process flowchart example depicts the Microsoft Dynamics CRM workflow from lead to opportunity. It was redesigned from the Wikimedia Commons file: Lead to Opportunity sales flow.svg. [commons.wikimedia.org/ wiki/ File:Lead_ to_ Opportunity_ sales_ flow.svg]
"Presales is a process or a set of activities normally carried out before a customer is acquired, though sometimes presales also extends into the period the product or service is delivered to the customer. ...
In a typical sales cycle the stages are:
(1) Contact.
(2) Lead / Suspect.
(3) Prospect / Opportunity.
The task of a presales person starts from the initial contact phase and often ends once the customer is acquired i.e. sale is made." [Presales. Wikipedia]
The process flowchart example "Lead to opportunity sales flow" was created using the ConceptDraw PRO diagramming and vector drawing software extended with the Sales Flowcharts solution from the Marketing area of ConceptDraw Solution Park.
Presales process flowchart
Basic of Flowchart: Meaning and Symbols


HelpDesk
How to Create a Sales Flowchart

Business Graphics Software

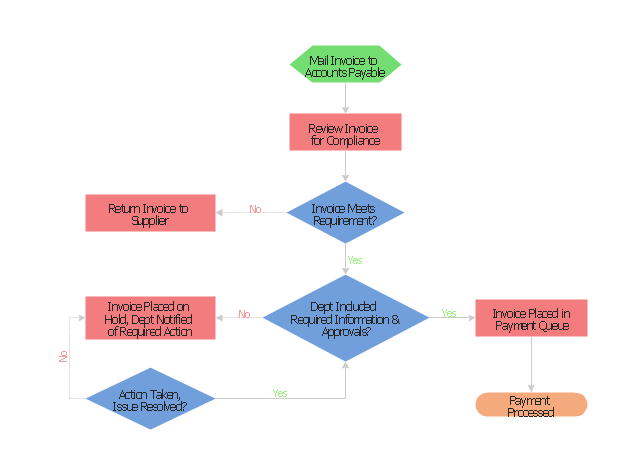
"An invoice, bill or tab is a commercial document issued by a seller to a buyer, relating to a sale transaction and indicating the products, quantities, and agreed prices for products or services the seller has provided the buyer.
Payment terms are usually stated on the invoice. These may specify that the buyer has a maximum number of days in which to pay, and is sometimes offered a discount if paid before the due date. The buyer could have already paid for the products or services listed on the invoice.
In the rental industry, an invoice must include a specific reference to the duration of the time being billed, so in addition to quantity, price and discount the invoicing amount is also based on duration. Generally each line of a rental invoice will refer to the actual hours, days, weeks, months, etc., being billed.
From the point of view of a seller, an invoice is a sales invoice. From the point of view of a buyer, an invoice is a purchase invoice. The document indicates the buyer and seller, but the term invoice indicates money is owed or owing. ...
Payment of invoices.
Organizations purchasing goods and services usually have a process in place for approving payment of invoices based on an employee's confirmation that the goods or services have been received.
Typically, when paying an invoice, a remittance advice will be sent to the supplier to inform them their invoice has been paid." [Invoice. Wikipedia]
The flow chart example "Invoice payment process" was created using the ConceptDraw PRO diagramming and vector drawing software extended with the Flowcharts solution from the area "What is a Diagram" of ConceptDraw Solution Park.
Flowchart - Invoice payment process
The Sales Process

Technical Flow Chart Example

Sales Process Map

Sales Process Management

It is effective to use professional software for the sales process management. ConceptDraw DIAGRAM diagramming and vector drawing software extended with Sales Flowcharts solution from the Marketing area of ConceptDraw Solution Park is the best choice.
The vector stencils library "Sales department" contains 49 company department icons.
Use these sales pictograms to draw your sales flowcharts, workflow diagrams and process charts with the ConceptDraw PRO diagramming and vector drawing software.
The vector stencils library "Sales department" is included in the Sales Flowcharts solution from the Marketing area of ConceptDraw Solution Park.
Accounting

Accounts payable

Accounts receivable

Audit

Bank

Board of directors

Copy center

Customer service operator

Customer service technician

Data center

Delivery

Design

Devices management

Distribution

Distribution

Employee

Engineering

Facilities

Finance

Human resource

Devices management

Information systems

International division

International marketing

International sales

Inventory

Legal department

Mail room

Mail service

Management

Manufacturing

Marketing

Motorpool

Online service

Packaging

Payroll

Publications

Purchasing

Quality assurance

Receiving

Reception

Research and development

Sales growth

Scales

Security

Shipping

Suppliers

Telecommunication

Warehouse

- Copying Service Process Flowchart . Flowchart Examples | Process ...
- Global Payment Solutions | Sales Flowcharts | Sales flowchart ...
- Logistics Flow Charts | Process Flow Chart Of Trucking Service
- Business diagrams & Org Charts with ConceptDraw DIAGRAM ...
- Land sales process flowchart | | After Sales Service Flowchart
- Sales Process Management | Sales Flowcharts | Sales Process ...
- Land sales process flowchart | After Sales Service Process Flow Chart
- The Hotel Sales Process Flowchart
- UML use case diagram - Banking system | Sales Process Flowcharts
- Cross Functional Flowchart Sales Process