Pyramid Diagram and Pyramid Chart
Pyramid Diagram is very useful to illustrate the foundation-based relationships. ConceptDraw PRO, a business charting software, includes some build-in symbols for designer to draw all kind of the pyramid diagrams.How to Create a Pie Chart
Create a Pie Chart with ConceptDraw software quickly and easily. The simple tutorial helps you learn how to create a pie chart.How to Create a Pyramid Diagram
ConceptDraw Pyramid Diagram software allows drawing column charts using predesigned objects or drawing tools. In ConceptDraw Pyramid Diagram software you can find a complete set of column chart tools and objects.Pyramid Chart Examples
Seeking a solution for maximizing the efficiencies throughout the pyramid charts? ConceptDraw examples to help you create pyramid diagrams quickly.Pyramid Diagram
The DIKW Pyramid refers loosely to a class of models for representing purported structural and/or functional relationships between data, information, knowledge, and wisdom.What Is a Picture Graph?
What is a Picture Graph? It's one of the most useful way which allows explain the information, statistical data in a visual form using the pictures. ConceptDraw PRO extended with Picture Graphs solution from the Graphs and Charts area offers you the easiest way of Picture Graphs drawing.Pyramid Diagrams
Pyramid Diagrams solution extends ConceptDraw PRO software with templates, samples and library of vector stencils for drawing the marketing pyramid diagrams.
Pyramid Diagram
The Project Management Triangle Diagram depicts three main constraints of any project: scope, time and cost. Projects have to comply with the specified scope, projects should be finished in time and projects need to consume the budget. Each of the constraints represents one side of the triangle, and any change in budget or timing or scope affects the entire diagram.Business Report Pie. Pie Chart Examples
This sample shows the Business Report Pie Chart. The Pie Chart visualizes the data as the proportional parts of a whole, illustrates the numerical proportion. Pie Charts are very useful in the business, statistics, analytics, mass media.Types of Flowcharts
A Flowchart is a graphically representation of the process, algorithm or the step-by-step solution of the problem. There are ten types of Flowcharts. Using the Flowcharts solution from the Diagrams area of ConceptDraw Solution Park you can easy and quickly design the Flowchart of any of these types.Gane Sarson Diagram
The vector stencils library Gane-Sarson Notation from the solution Data Flow Diagrams contains specific symbols of the Gane-Sarson notation such as process symbol, connector symbol, jump symbol for ConceptDraw PRO diagramming and vector drawing software. The Data Flow Diagrams solution is contained in the Software Development area of ConceptDraw Solution Park.Org Chart Diagram
ConceptDraw Solution Park creates a single information space for messaging to teams. PM Teams provides project participants and organizations with better tools that assist in task understanding, timeframe understanding, and project events in the entire organization. Improved communication fosters positive team spirit throughout.
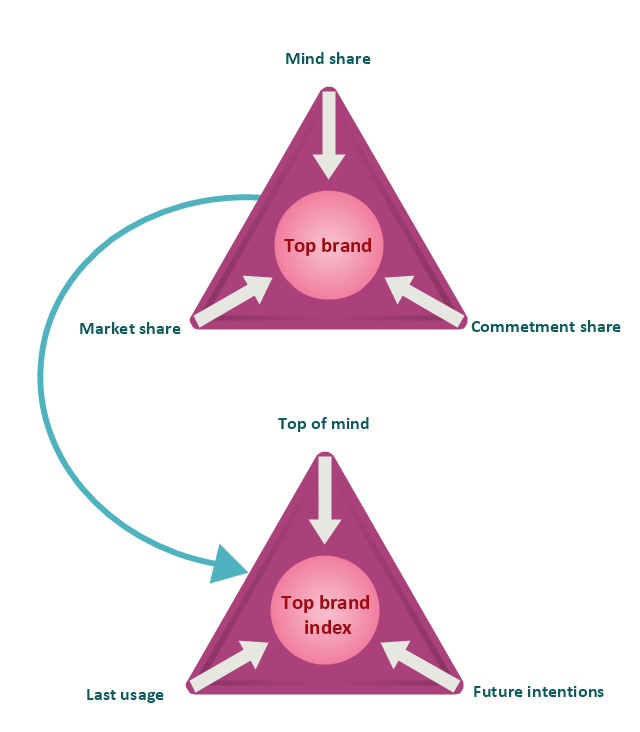
"Brand awareness refers to customers' ability to recall and recognize the brand under different conditions and link to the brand name, logo, jingles and so on to certain associations in memory. It consists of both brand recognition and brand recall. It helps the customers to understand to which product or service category the particular brand belongs and what products and services are sold under the brand name. It also ensures that customers know which of their needs are satisfied by the brand through its products (Keller). Brand awareness is of critical importance since customers will not consider your brand if they are not aware of it. There are various levels of brand awareness that require different levels and combinations of brand recognition and recall. Top-of-Mind is the goal of most companies. Top-of-mind awareness occurs when your brand is what pops into a consumers mind when asked to name brands in a product category." [Brand. Brand awareness. Wikipedia]
This top brand model pyramid diagram was redesigned using the ConceptDraw PRO diagramming and vector drawing software from Wikimedia Commons file Diagram Top Brand Model.jpg. [commons.wikimedia.org/ wiki/ File:Diagram_ Top_ Brand_ Model.jpg]
This file is licensed under the Creative Commons Attribution-Share Alike 3.0 Unported license. [creativecommons.org/ licenses/ by-sa/ 3.0/ deed.en]
The example "Top brand model pyramid diagram" is included in the Pyramid Diagrams solution from the Marketing area of ConceptDraw Solution Park.
Sales Steps
Helps to create professionally looking and detailed Sales Flowcharts with all sales steps visually represented on them.Use the Sales Flowcharts Solution for ConceptDraw PRO software to create your own Sales Flowcharts of any complexity quickly, easily and effectively to use them successfully in your work activity.
ConceptDraw PRO diagramming and vector drawing software supplied with unique Sales Flowcharts solution from the Marketing area of ConceptDraw Solution Park allows fast and easy visualize all sales steps of the sales process on a sales process Map or sales process flowchart, and then realize them easily.
How to Create a Social Media DFD Flowchart
Interactive tool helps you create a social media DFD flowchart to find the appropriate response to social media mentions quickly.It allows companies to be more effective in timely messaging thanks to the ability for rapid response to a customer′s post in social media. This saves budget for companies who use social media for promoting and as a lead generation tool.
- Pyramid Chart Examples | Life cycle analysis - Ring chart | Basic ...
- 4 Level pyramid model diagram - Information systems types ...
- Affinity Diagram | Life cycle analysis - Ring chart | Pyramid Chart ...
- Competitor Analysis | Pyramid Chart Examples | Create Graphs and ...
- Logistics Flow Charts | Economic sector weightings | Pyramid Chart ...
- Pie Charts | Bar Diagram Math | Pyramid Chart Examples | Pie Chart ...
- Competitor Analysis | Pyramid Chart Examples | Life cycle analysis ...
- Pie Charts | Organizational Charts with ConceptDraw PRO | Pyramid ...
- Types of Flowcharts | Physics Diagrams | Pyramid Chart Examples ...
- Pyramid Chart Uses
- Pyramid Diagram | Pyramid Diagram | Pyramid Chart Examples ...
- Pyramid Chart Examples | Bar Diagram Math | UK Map | Natural ...
- Pyramid Diagram | Enterprise Architecture Diagrams | How to Create ...
- Pyramid Charts | Pyramid Chart Examples | Circle-Spoke Diagrams ...
- What Is Management Uses Of Information Processed Pyramid
- Pyramid Diagram | Software Work Flow Process in Project ...
- Logistics Flow Charts | Pie Charts | Life cycle analysis - Ring chart ...
- Process Flowchart | Pyramid Diagram and Pyramid Chart | Pyramid ...
- Energy Pyramid Diagram | Resources and energy - Vector stencils ...
- Pyramid Diagram | Marketing Analysis Diagram | Target Diagram ...
- ERD | Entity Relationship Diagrams, ERD Software for Mac and Win
- Flowchart | Basic Flowchart Symbols and Meaning
- Flowchart | Flowchart Design - Symbols, Shapes, Stencils and Icons
- Flowchart | Flow Chart Symbols
- Electrical | Electrical Drawing - Wiring and Circuits Schematics
- Flowchart | Common Flowchart Symbols