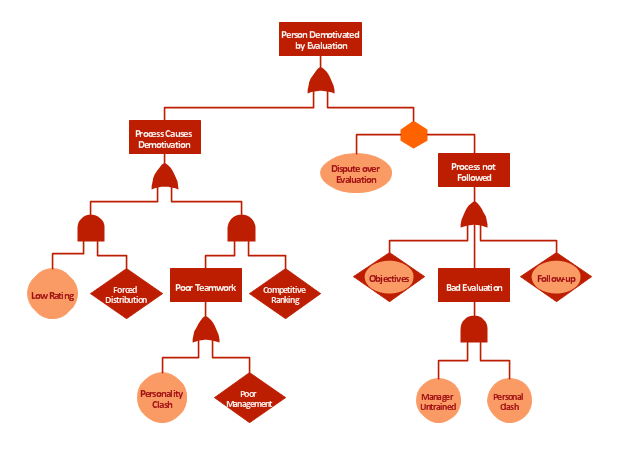
PROBLEM ANALYSIS. Root Cause Analysis Tree Diagram


"Subjective performance evaluation allows the use of a subtler, more balanced assessment of employee performance, and is typically used for more complex jobs where comprehensive objective measures are difficult to specify and/ or measure. Whilst often the only feasible method, the attendant problems with subjective performance evaluation have resulted in a variety of incentive structures and supervisory schemes. One problem, for example, is that supervisors may under-report performance in order to save on wages, if they are in some way residual claimants, or perhaps rewarded on the basis of cost savings. This tendency is of course to some extent offset by the danger of retaliation and/ or demotivation of the employee, if the supervisor is responsible for that employee’s output. ...
Another problem relates to what is known as the "compression of ratings". Two related influences—centrality bias, and leniency bias—have been documented ... The former results from supervisors being reluctant to distinguish critically between workers (perhaps for fear of destroying team spirit), while the latter derives from supervisors being averse to offering poor ratings to subordinates, especially where these ratings are used to determine pay, not least because bad evaluations may be demotivating rather than motivating. However, these biases introduce noise into the relationship between pay and effort, reducing the incentive effect of performance-related pay. ... this is the reason for the common separation of evaluations and pay, with evaluations primarily used to allocate training.
Finally, while the problem of compression of ratings originates on the supervisor-side, related effects occur when workers actively attempt to influence the appraisals supervisors give, either by influencing the performance information going to the supervisor: multitasking (focussing on the more visibly productive activities...), or by working “too hard” to signal worker quality or create a good impression...; or by influencing the evaluation of it, e.g., by "currying influence"... or by outright bribery..." [Principal–agent problem. Wikipedia]
The example "Person demotivated by evaluation - Fault tree analysis diagram" was created using the ConceptDraw PRO diagramming and vector drawing software extended with the Fault Tree Analysis Diagrams solution from the Engineering area of ConceptDraw Solution Park.
FTA diagram
"A root cause is an initiating cause of a causal chain which leads to an outcome or effect of interest. Commonly, root cause is used to describe the depth in the causal chain where an intervention could reasonably be implemented to change performance and prevent an undesirable outcome." [Root cause. Wikipedia]
"Problem-solving consists of using generic or ad hoc methods, in an orderly manner, for finding solutions to problems. Some of the problem-solving techniques developed and used in artificial intelligence, computer science, engineering, mathematics, medicine, etc. are related to mental problem-solving techniques studied in psychology." [Problem solving. Wikipedia]
This root cause analysis (RCA) tree diagram example "Personal problem solution" was created using the ConceptDraw PRO diagramming and vector drawing software extended with the Seven Management and Planning Tools solution from the Management area of ConceptDraw Solution Park.
Tree diagram

HelpDesk
How To Create Root Cause Analysis Diagram Using ConceptDraw Office

Cause and Effect Analysis

Problem solving

"Root cause analysis (RCA) is a method of problem solving that tries to identify the root causes of faults or problems.
RCA practice tries to solve problems by attempting to identify and correct the root causes of events, as opposed to simply addressing their symptoms. Focusing correction on root causes has the goal of preventing problem recurrence. RCFA (Root Cause Failure Analysis) recognizes that complete prevention of recurrence by one corrective action is not always possible.
Conversely, there may be several effective measures (methods) that address the root causes of a problem. Thus, RCA is an iterative process and a tool of continuous improvement.
RCA is typically used as a reactive method of identifying event(s) causes, revealing problems and solving them. Analysis is done after an event has occurred. Insights in RCA may make it useful as a preemptive method. In that event, RCA can be used to forecast or predict probable events even before they occur. While one follows the other, RCA is a completely separate process to Incident Management." [Root cause analysis. Wikipedia]
The root cause analysis (RCA) tree diagram example "Manufacturing problem solution" was created using the ConceptDraw PRO diagramming and vector drawing software extended with the solution "Seven Management and Planning Tools" from the Management area of ConceptDraw Solution Park.
Tree diagram

Fault Tree Analysis Software

PROBLEM ANALYSIS. Identify and Structure Factors

Root Cause Analysis

"Root cause analysis (RCA) is a method of problem solving that tries to identify the root causes of faults or problems. ...
RCA (in steps 3, 4 and 5) forms the most critical part of successful corrective action, because it directs the corrective action at the true root cause of the problem. Knowing the root cause is secondary to the goal of prevention, but without knowing the root cause, it is not possible to determine what an effective corrective action for the defined problem would be. ...
3. Ask "why" and identify the causes associated with each step in the sequence towards the defined problem or event. "Why" is taken to mean "What were the factors that directly resulted in the effect?"
4. Classify causes into causal factors that relate to an event in the sequence and root causes, that if eliminated, can be agreed to have interrupted that step of the sequence chain.
5. Identify all other harmful factors that have equal or better claim to be called "root causes." If there are multiple root causes, which is often the case, reveal those clearly for later optimum selection." [Root cause analysis. Wikipedia]
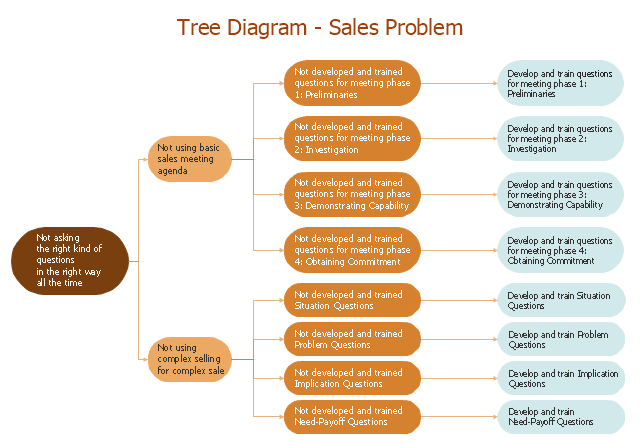
This root cause analysis (RCA) tree diagram example "Sale problem solution" was created using the ConceptDraw PRO diagramming and vector drawing software extended with the Seven Management and Planning Tools solution from the Management area of ConceptDraw Solution Park.
RCA (in steps 3, 4 and 5) forms the most critical part of successful corrective action, because it directs the corrective action at the true root cause of the problem. Knowing the root cause is secondary to the goal of prevention, but without knowing the root cause, it is not possible to determine what an effective corrective action for the defined problem would be. ...
3. Ask "why" and identify the causes associated with each step in the sequence towards the defined problem or event. "Why" is taken to mean "What were the factors that directly resulted in the effect?"
4. Classify causes into causal factors that relate to an event in the sequence and root causes, that if eliminated, can be agreed to have interrupted that step of the sequence chain.
5. Identify all other harmful factors that have equal or better claim to be called "root causes." If there are multiple root causes, which is often the case, reveal those clearly for later optimum selection." [Root cause analysis. Wikipedia]
This root cause analysis (RCA) tree diagram example "Sale problem solution" was created using the ConceptDraw PRO diagramming and vector drawing software extended with the Seven Management and Planning Tools solution from the Management area of ConceptDraw Solution Park.
RCA diagram
Root Cause Tree Diagram

Decision Making

PROBLEM ANALYSIS. Prioritization Matrix

The Action Plan

- Root cause analysis tree diagram - Template | PROBLEM ...
- Root cause analysis tree diagram - Manufacturing problem solution ...
- Fault Tree Analysis Diagrams
- Root cause analysis tree diagram - Template | Fault Tree Diagram ...
- Root cause analysis tree diagram - Personal problem solution | Root ...
- Root cause analysis tree diagram - Personal problem solution ...
- Root cause analysis tree diagram - Manufacturing problem solution
- Problem Tree Analysis Ppt
- PROBLEM ANALYSIS . Root Cause Analysis Tree Diagram
- How To Carry Out Problem Tree Analysis In Project Management
- PROBLEM ANALYSIS . Root Cause Analysis Tree Diagram | Seven ...
- PROBLEM ANALYSIS . Root Cause Analysis Tree Diagram | Cause ...
- Cause and Effect Analysis | The Action Plan | TQM Diagram Tool ...
- PROBLEM ANALYSIS . Root Cause Analysis Tree Diagram ...
- Cause and Effect Analysis | Root cause analysis tree diagram ...
- Cause and Effect Analysis | Fault Tree Analysis Software | TQM ...
- ConceptDraw PRO | Seating Plans | Problem Tree Clip Ary
- PROBLEM ANALYSIS . Root Cause Analysis Tree Diagram | Helpful ...
- Fault Tree Analysis Diagrams
- Cause and Effect Analysis - Fishbone Diagrams for Problem Solving ...