Cause and Effect Analysis


Fault Tree Analysis Software

TQM Diagram Tool

The Action Plan

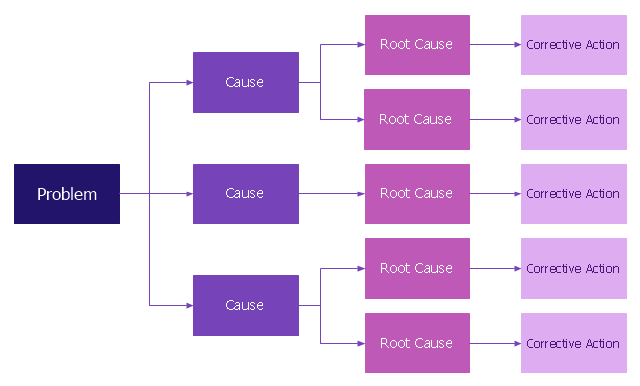
PROBLEM ANALYSIS. Root Cause Analysis Tree Diagram

Root Cause Analysis

Root cause analysis (RCA) tree diagram lets identify the root causes for a factor and then list possible corrective action. The diagram displays the structure of causes for a factor and possible corrective actions. The root cause analysis tree diagram is used for further formulation of actions.
"Tree Diagram.
This tool is used to break down broad categories into finer and finer levels of detail. It can map levels of details of tasks that are required to accomplish a goal or solution or task. Developing the tree diagram helps one move their thinking from generalities to specifics." [Seven Management and Planning Tools. Wikipedia]
This root cause analysis tree diagram template for the ConceptDraw PRO diagramming and vector drawing software is included in the Seven Management and Planning Tools solution from the Management area of ConceptDraw Solution Park.
RCA diagram
Cause and Effect Analysis - Fishbone Diagrams for Problem Solving

PROBLEM ANALYSIS. Identify and Structure Factors

Fire Evacuation Plan Template

Affinity Diagram

Fishbone Diagram Problem Solving

Context Diagram Template

This template shows the Context Diagram. It was created in ConceptDraw PRO diagramming and vector drawing software using the Block Diagrams Solution from the “What is a Diagram” area of ConceptDraw Solution Park. The context diagram graphically identifies the system. external factors, and relations between them. It’s a high level view of the system. The context diagrams are widely used in software engineering and systems engineering for designing the systems that process the information.
Authority Matrix Diagram Software

- Problem Solution Tree Templates
- Solution Tree
- Root cause analysis tree diagram - Template | PROBLEM ...
- Root cause analysis tree diagram - Personal problem solution ...
- Root cause analysis tree diagram - Template | Fault Tree Diagram ...
- Root cause analysis tree diagram - Personal problem solution ...
- PROBLEM ANALYSIS. Root Cause Analysis Tree Diagram ...
- PROBLEM ANALYSIS. Root Cause Analysis Tree Diagram | Root ...
- Root cause analysis tree diagram - Template
- Root cause analysis tree diagram - Personal problem solution | Root ...
- Problems Tree Analysis Templates
- Decision Making Tree Template
- PROBLEM ANALYSIS. Root Cause Analysis Tree Diagram | Cause ...
- PROBLEM ANALYSIS. Root Cause Analysis Tree Diagram | Seven ...
- PROBLEM ANALYSIS. Root Cause Analysis Tree Diagram ...
- Fault Tree Analysis Diagrams
- Business Mgt Problem Tree Sample
- Root cause analysis tree diagram - Manufacturing problem solution
- Root cause analysis tree diagram - Template | New Year card ...
- Root cause analysis tree diagram - Personal problem solution | Root ...