PROBLEM ANALYSIS. Root Cause Analysis Tree Diagram


PROBLEM ANALYSIS. Identify and Structure Factors

Problem Analysis

PROBLEM ANALYSIS. Relations Diagram

Root Cause Tree Diagram

 Seven Management and Planning Tools
Seven Management and Planning Tools solution extends ConceptDraw PRO and ConceptDraw MINDMAP with features, templates, samples and libraries of vector stencils for drawing management mind maps and diagrams.
PROBLEM ANALYSIS. Prioritization Matrix

Helpful in all stages of quality management

Root Cause Analysis

Problem solving

 Seven Management and Planning Tools
Seven Management and Planning Tools solution extends ConceptDraw PRO and ConceptDraw MINDMAP with features, templates, samples and libraries of vector stencils for drawing management mind maps and diagrams.
HelpDesk
How To Create Root Cause Analysis Diagram Using ConceptDraw Office

"Subjective performance evaluation allows the use of a subtler, more balanced assessment of employee performance, and is typically used for more complex jobs where comprehensive objective measures are difficult to specify and/ or measure. Whilst often the only feasible method, the attendant problems with subjective performance evaluation have resulted in a variety of incentive structures and supervisory schemes. One problem, for example, is that supervisors may under-report performance in order to save on wages, if they are in some way residual claimants, or perhaps rewarded on the basis of cost savings. This tendency is of course to some extent offset by the danger of retaliation and/ or demotivation of the employee, if the supervisor is responsible for that employee’s output. ...
Another problem relates to what is known as the "compression of ratings". Two related influences—centrality bias, and leniency bias—have been documented ... The former results from supervisors being reluctant to distinguish critically between workers (perhaps for fear of destroying team spirit), while the latter derives from supervisors being averse to offering poor ratings to subordinates, especially where these ratings are used to determine pay, not least because bad evaluations may be demotivating rather than motivating. However, these biases introduce noise into the relationship between pay and effort, reducing the incentive effect of performance-related pay. ... this is the reason for the common separation of evaluations and pay, with evaluations primarily used to allocate training.
Finally, while the problem of compression of ratings originates on the supervisor-side, related effects occur when workers actively attempt to influence the appraisals supervisors give, either by influencing the performance information going to the supervisor: multitasking (focussing on the more visibly productive activities...), or by working “too hard” to signal worker quality or create a good impression...; or by influencing the evaluation of it, e.g., by "currying influence"... or by outright bribery..." [Principal–agent problem. Wikipedia]
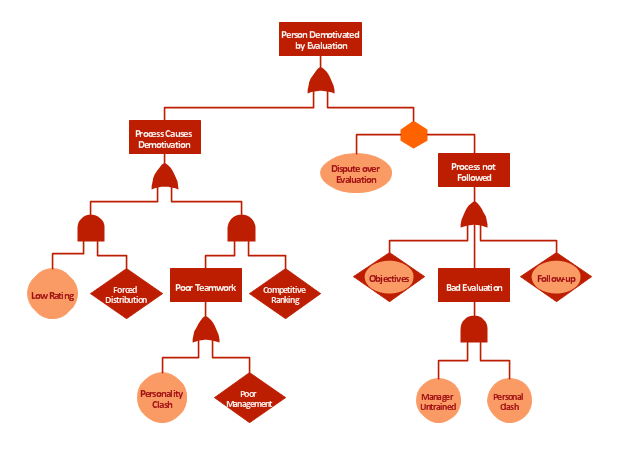
The example "Person demotivated by evaluation - Fault tree analysis diagram" was created using the ConceptDraw PRO diagramming and vector drawing software extended with the Fault Tree Analysis Diagrams solution from the Engineering area of ConceptDraw Solution Park.
Another problem relates to what is known as the "compression of ratings". Two related influences—centrality bias, and leniency bias—have been documented ... The former results from supervisors being reluctant to distinguish critically between workers (perhaps for fear of destroying team spirit), while the latter derives from supervisors being averse to offering poor ratings to subordinates, especially where these ratings are used to determine pay, not least because bad evaluations may be demotivating rather than motivating. However, these biases introduce noise into the relationship between pay and effort, reducing the incentive effect of performance-related pay. ... this is the reason for the common separation of evaluations and pay, with evaluations primarily used to allocate training.
Finally, while the problem of compression of ratings originates on the supervisor-side, related effects occur when workers actively attempt to influence the appraisals supervisors give, either by influencing the performance information going to the supervisor: multitasking (focussing on the more visibly productive activities...), or by working “too hard” to signal worker quality or create a good impression...; or by influencing the evaluation of it, e.g., by "currying influence"... or by outright bribery..." [Principal–agent problem. Wikipedia]
The example "Person demotivated by evaluation - Fault tree analysis diagram" was created using the ConceptDraw PRO diagramming and vector drawing software extended with the Fault Tree Analysis Diagrams solution from the Engineering area of ConceptDraw Solution Park.
FTA diagram
Quality Management Teams

HelpDesk
How to Manage Problem Solving Using Seven Management and Planning Tools

- Root cause analysis tree diagram - Template
- Structure Of A Problem Tree Pdf
- Factors Influencing Sales Using Problem Tree Analysis
- PROBLEM ANALYSIS. Root Cause Analysis Tree Diagram ...
- Tool To Create Tree Structure
- Organizational Structure | PROBLEM ANALYSIS. Root Cause ...
- PROBLEM ANALYSIS. Root Cause Analysis Tree Diagram | Cause ...
- Problem Tree Analysis Ppt
- PROBLEM ANALYSIS. Root Cause Analysis Tree Diagram
- Root cause analysis tree diagram - Manufacturing problem solution
- PROBLEM ANALYSIS. Root Cause Analysis Tree Diagram | Person ...
- Draw The Tree Structure Of Memory And Describe It With Example
- PROBLEM ANALYSIS. Relations Diagram | PROBLEM ANALYSIS ...
- PROBLEM ANALYSIS. Root Cause Analysis Tree Diagram | Root ...
- Root cause analysis tree diagram - Manufacturing problem solution ...
- PROBLEM ANALYSIS. Root Cause Analysis Tree Diagram
- PROBLEM ANALYSIS. Root Cause Analysis Tree Diagram
- Root cause analysis tree diagram - Template | Fault Tree Analysis ...
- Organizational Structure | PROBLEM ANALYSIS. Identify and ...