Bar Diagrams for Problem Solving. Create space science bar charts with Bar Graphs Solution
Bar charts represent data in different categories or groups. Create bar graphs for visual solving your scientific problems and data comparison using the ConceptDraw DIAGRAM diagramming and vector drawing software extended with the Bar Graphs Solution from the Graphs and Charts area of ConceptDraw Solition Park.Pyramid Chart Examples
Pyramid Charts and Triangle Diagrams are used to visually structure the topics and progressively order the quantitative data. They allow to illustrate hierarchical structure of the topics, proportional, interconnected and containment relations among the topics. The multilevel Pyramids and Triangle diagrams are constructed oriented up or down and divided into several horizontal slices. They are effectively used to represent marketing strategies, social strategies, information systems, market value, etc., to illustrate presentations, websites, documents, reports in business, finances, sales, management, marketing, media, training, consulting, and many other fields. To maximize the efficiency in drawing the Pyramid Charts, use the ConceptDraw DIAGRAM diagramming and vector drawing software extended with Pyramid Diagrams solution from Marketing area, which contains the set of Pyramid Chart examples, samples, templates and vector design elements of triangular diagrams and pyramids with different quantity of levels for various needs.
 Bar Graphs
The Bar Graphs solution enhances ConceptDraw DIAGRAM functionality with templates, numerous professional-looking samples, and a library of vector stencils for drawing different types of Bar Graphs, such as Simple Bar Graph, Double Bar Graph, Divided Bar Graph, Horizontal Bar Graph, Vertical Bar Graph, and Column Bar Chart.
How To Make Histogram in ConceptDraw DIAGRAM ?
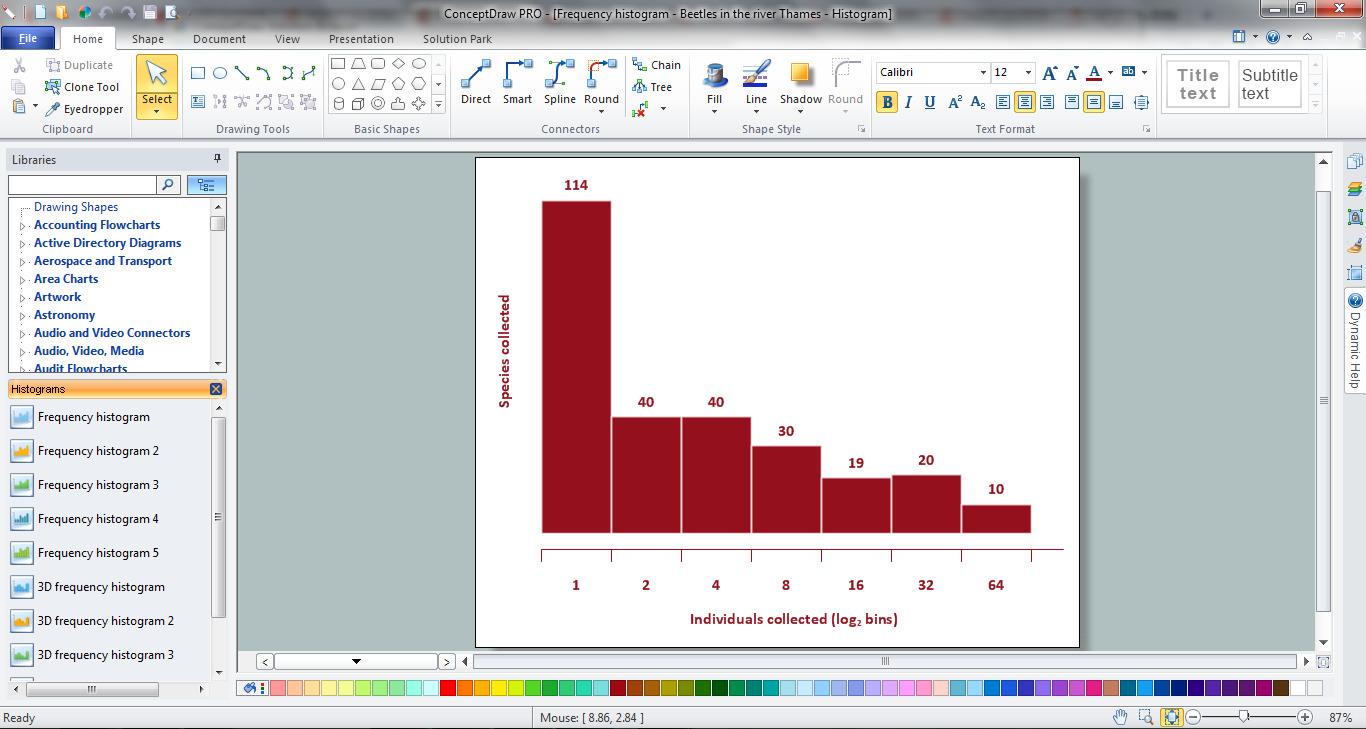
How to make histogram in ConceptDraw DIAGRAM ? ConceptDraw DIAGRAM diagramming and vector drawing software is the best choice for making professional looking Histograms. ConceptDraw DIAGRAM provides Histograms solution from the Graphs and Charts Area of ConceptDraw Solution Park.
 Enterprise Architecture Diagrams
Enterprise Architecture Diagrams solution extends ConceptDraw DIAGRAM software with templates, samples and library of vector stencils for drawing the diagrams of enterprise architecture models.
Histogram
ConceptDraw DIAGRAM diagramming and vector drawing software offers the Histograms solution from the Graphs and Charts area of ConceptDraw Solution Park with powerful tools to help you draw a Histogram of any complexity quick and easy.Making a Histogram
ConceptDraw DIAGRAM is a powerful diagramming and vector drawing software. Extended with Histograms solution from the Graphs and Charts area, ConceptDraw DIAGRAM became the ideal software for making a Histogram.How To Make a Histogram?
How to make a Histogram quick and easy? ConceptDraw DIAGRAM diagramming and vector drawing software extended with Histograms solution from the Graphs and Charts area will effectively help you in Histogram drawing.
 ConceptDraw Solution Park
ConceptDraw Solution Park collects graphic extensions, examples and learning materials
 Histograms
How to make a Histogram? Making a Histogram is an incredibly easy process when it is done with ConceptDraw DIAGRAM. The Histograms Solution enhances ConceptDraw DIAGRAM functionality with extensive drawing tools, numerous samples, and examples; also a quick-start template and library of ready vector stencils for visualization the data and professional drawing Histograms.
 Health Food
The Health Food solution contains the set of professionally designed samples and large collection of vector graphic libraries of healthy foods symbols of fruits, vegetables, herbs, nuts, beans, seafood, meat, dairy foods, drinks, which give powerful possi
 Circle-Spoke Diagrams
Examples of subject areas that are well suited to this approach are marketing, business, products promotion, process modeling, market, resource, time, and cost analysis. Circle-Spoke Diagrams are successfully used in presentations, conferences, management documents, magazines, reportages, reviews, reports, TV, and social media.
- Chart Maker for Presentations | Pie chart - Template | Design ...
- Pie chart - Template | Design elements - Composition charts and ...
- How to Create a Pie Chart | How to Draw the Different Types of Pie ...
- Onion Diagram
- Circle Spoke Diagram Template | 3 Circle Venn. Venn Diagram ...
- Circle Spoke Diagram Template
- Sector diagram - Template | How To Create Onion Diagram ...
- Sector diagram - Template | Stakeholder Onion Diagrams | How To ...
- Pie Charts | Pie Chart Examples and Templates | Pie Chart Software ...
- Sector diagram - Template | How To Create Onion Diagram ...
- Bar Diagrams for Problem Solving. Create space science bar charts ...
- Chart Maker for Presentations | Pie Charts | Design elements ...
- Sector diagram - Template | Process Flowchart | How To Create ...
- Basic Circles Venn Diagram
- Target market - Onion diagram | Target diagrams - Vector stencils ...
- 2 Circle Venn Diagram . Venn Diagram Example
- How to Draw the Different Types of Pie Charts | Chart Templates ...
- How to Draw a Divided Bar Chart in ConceptDraw PRO ...
- Organization Circle Diagram Chart


