Pie Chart Software

Pie Chart Examples and Templates

Pie Graph Worksheets

Basic Diagramming


 Pie Charts
Pie Charts are extensively used in statistics and business for explaining data and work results, in mass media for comparison (i.e. to visualize the percentage for the parts of one total), and in many other fields. The Pie Charts solution for ConceptDraw DIAGRAM offers powerful drawing tools, varied templates, samples, and a library of vector stencils for simple construction and design of Pie Charts, Donut Chart, and Pie Graph Worksheets.
Program to Make Flow Chart

Donut Chart Templates

Percentage Pie Chart. Pie Chart Examples

ConceptDraw PROJECT Software Overview

 Basic Pie Charts
This solution extends the capabilities of ConceptDraw DIAGRAM (or later) with templates, samples, and a library of vector stencils for drawing pie and donut charts.
Pie Chart Software
Business Process Elements: Events


Pie Chart

Feature Comparison Chart Software

Scatter Graph Charting Software

Use the Best FlowChart Tool for the Job

How to Create a Process Flowchart

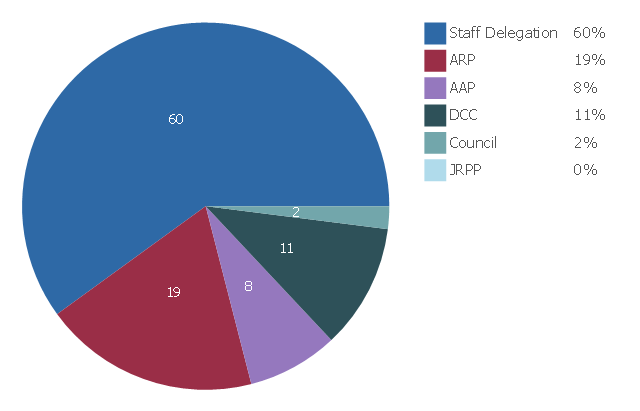
This pie chart sample shows Development Assessment determination for 2014-2015. It was redesigned from the web page "Building and development - How are Development Applications assessed - Determination (approval or rejection)" from the Woollahra Municipal Council (New South Wales, Australia) website. [woollahra.nsw.gov.au/ building_ and_ development/ how_ we_ assess_ your_ da/ determination_ approval_ or_ rejection]
This file is available under the Creative Commons Attribution-ShareAlike 3.0 Unported License [creativecommons.org/ licenses/ by-sa/ 3.0/ ].
"A pie chart (or a circle graph) is a circular chart divided into sectors, illustrating numerical proportion. In a pie chart, the arc length of each sector (and consequently its central angle and area), is proportional to the quantity it represents. While it is named for its resemblance to a pie which has been sliced, there are variations on the way it can be presented. ...
Pie charts are very widely used in the business world and the mass media." [Pie chart. Wikipedia]
The pie chart example "Development Assessment determination" was created using the ConceptDraw PRO diagramming and vector drawing software extended with the Pie Charts solution of the Graphs and Charts area in ConceptDraw Solution Park.
Pie chart
Pyramid Diagram

Influence Diagram

- How to Draw a Pie Chart Using ConceptDraw PRO | Venn Diagram ...
- Software development with ConceptDraw DIAGRAM | Pie Charts ...
- Venn Diagram Examples for Problem Solving. Environmental Social ...
- Basic Diagramming - Ring chart | Life Development Pie Chart
- Pie Charts | Human Resource Development | Non Renewable ...
- Pie Charts | | Pie Chart Software | Circle Graph Png Images
- Pie Chart Word Template. Pie Chart Examples | Pie Chart | Social ...
- ATM UML Diagrams | Software Development Area | Pie Chart Of ...
- Schedule pie chart - Daily action plan | Software development with ...
- How to Draw a Circular Arrows Diagram | Circular Arrow | Circular ...