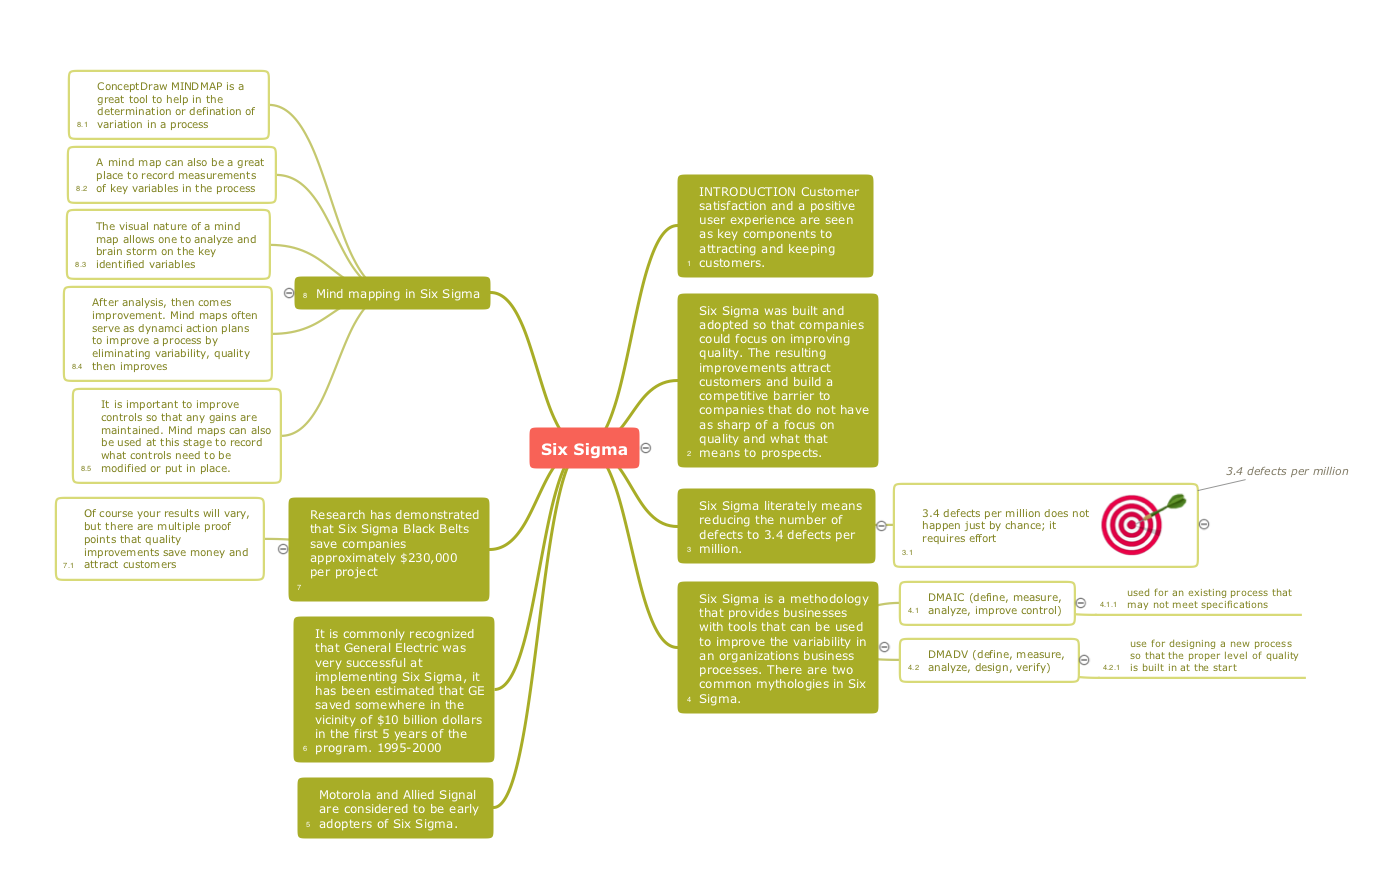
Quality Mind Map
This solution extends ConceptDraw MINDMAP software with Quality Management Mind Maps (Presentations, Meeting Agendas, Problem to be solved).
HelpDesk
How to Create a Fishbone (Ishikawa) Diagram Quickly
A Fishbone (Ishikawa) diagram is also called a cause-and-effect diagram. Fishbone diagram is often used in business to determine the cause of some problem. The diagram illustrates the main causes and sub-causes leading to an event. The main goal of the Fishbone diagram is to illustrate in a graphical way the relationship between a given outcome and all the factors that influence this outcome. The complete diagram resembles a fish skeleton as its name implies. The ability to create a Fishbone Diagram is supported by the Fishbone Diagram solution. Use ConceptDraw MINDMAP for structuring data and then ConceptDraw DIAGRAM for generating a Fishbone Diagram from mind map structure.HelpDesk
How To Create an Affinity Diagram Using Solutions
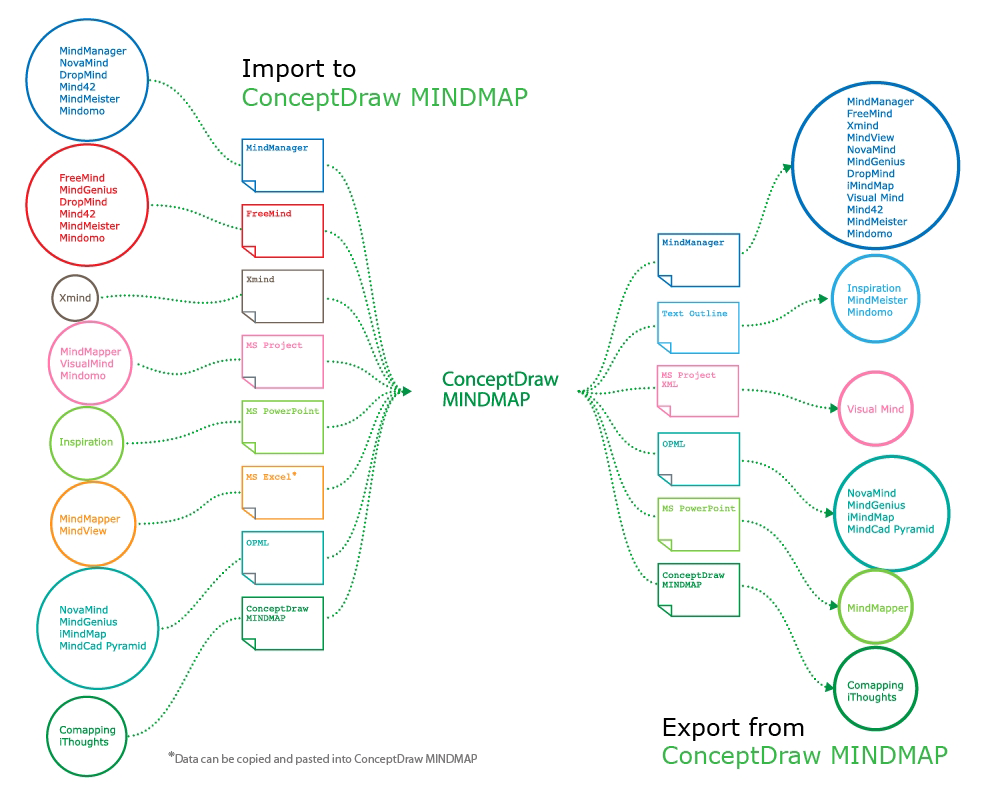
The affinity diagram is designed to prepare the data for further analysis of the cause-effect relationships. The Affinity diagram shows the structure of large, complex factors that have an influence on a problem, and then divides them up into a smaller and simpler structure. We recommend using a mind map for Brainstorming and collecting the factors affecting the problem. The ability to create an Affinity diagram from a mind map is supported by the ConceptDraw Seven Management and Planning Tools solution.
Mind Map Exchange
This solution extends ConceptDraw MINDMAP software with the ability to easily exchange mind maps with a large variety of other mind mapping applications.
HelpDesk
How To Create the Interaction (Relations) Diagram
Identify relationships between factors affecting a problem using interaction (relation) diagram. The ability to create a Relation diagram from a mind map is supported by the ConceptDraw Seven Management and Planning Tools solution.Quality Mind Maps - samples and templates
Use samples and templates to describe your own quality processes, brainstorm, and structure quality issues.Examples of Flowcharts, Org Charts and More
ConceptDraw examples covers a broad spectrum of business graphics categories. We separated all the graphic documents on application areas and had produced multiple solutions for each of them. ConceptDraw provides a wide variety of examples such as flowcharts, organizational charts, business charts, UML diagrams, database and ERD, directional map, network diagrams and lots more. Each solution accommodates 10+ examples that shows specific application cases of a diagram. ConceptDraw STORE is an application for downloading solutions with examples, templates and stencil libraries. Please choose any examples you are interested in, alternatively download them for free; you will need to install ConceptDraw to view them. As you will see, ConceptDraw is very powerful, you can use more than 10000 symbols, examples, and many pre-drawn templates, to create your own spectacular flowcharts, business diagrams, network diagrams and lots more, effortlessly, and in no time at all.
HelpDesk
How To Create Root Cause Analysis Diagram Using Solutions
Root Cause Analysis diagram is used to analyze the root causes of factors that influence the problem. If the certain factor is the root cause, this mean that its vanishing will help to prevent the further recurrence of the problem. Root Cause diagram helps to identify the root causes for a factor and then propose possible corrective actions. A diagram is constructed separately for each high priority factor. The ability to create a RCA tree diagram from a mind map is supported by the ConceptDraw Seven Management and Planning Tools solution.HelpDesk
How To Create Risk Diagram (PDPC) Using Solutions
Risk diagram is used to identify possible risks in accomplishing corrective actions. With the Risks diagram, one analyzes each action separately in a tree of all actions and develops a preventive action in response to each potential obstacles or circumstances which may be a risk. The ability to create a Risk diagram from a mind map is supported by the ConceptDraw Seven Management and Planning Tools solution. This article describes how to identify possible risks when carrying out corrective actions, and define preventive actions.HelpDesk
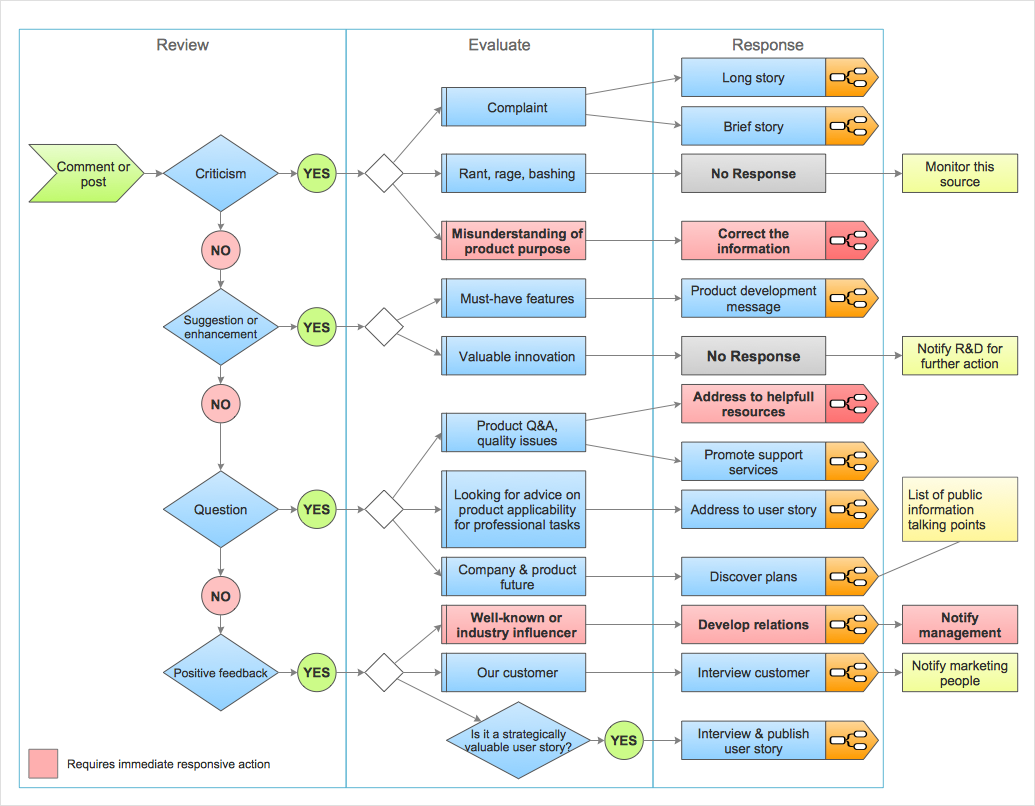
How to Organize a Social Media Activity
Interactive Flowcharts describes the social media response process. The Action mind map shows examples of messages, and also defines the main objective of messaging for a specific situation. ConceptDraw Social Media Response solution helps to organize the process of response for interactions occurring in social media.HelpDesk
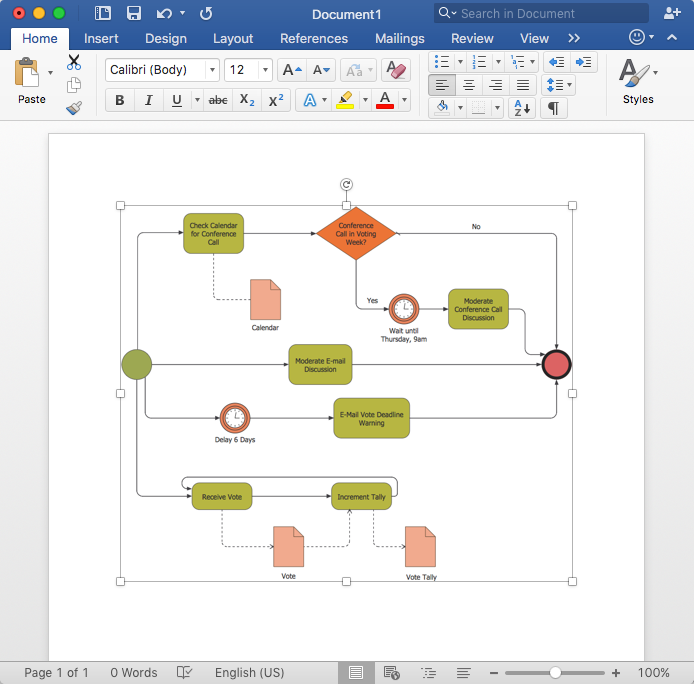
How to Add a Business Process Diagram to MS Word Document
ConceptDraw DIAGRAM allows you to easily create business process diagrams and then add them to an MS Word document.
Education Mind Maps
This solution extends ConceptDraw MINDMAP software with scientific and educational mind maps for educational documents, presentations, and websites.
SWOT Sample in Computers
The ConceptDraw is a best diagram software. The SWOT Analysis solution includes the SWOT matrix samples, and templates that allow users create own SWOT diagram.HelpDesk
How to Create a Vehicular Network Diagram
ConceptDraw Vehicular Networking solution can help network engineers, network architects to design, analyze and present vehicular network diagrams quickly and efficiently. The Solution provides a possibility to swiftly develop conceptual diagrams for vehicular networking. A set of templates and objects delivered with this solution allows making conceptual diagrams of global and local vehicular networks. Using the Vehicular Networking solution makes much easier the work on documenting the Vehicular Networks.HelpDesk
How to Develop a Business Process Model
An overview of any business process includes the description of the steps needed to implement any business task. The best approach to business process designing and analyzing is to depict visually the steps of the business process in the form of the business process diagram. Designing a Business Process diagram includes many different and specific elements that can be managed using ConceptDraw DIAGRAM. The ability to create Business Process diagrams according to the BPMN 2.0 is provided by the Business Process Model and Notation solution.HelpDesk
How to Use Mind Map Exchange Solution
Using ConceptDraw MINDMAP you can import and export files of Microsoft Project, MindManager, XMind, FreeMind, Microsoft Office, and many other project management and mind mapping applications. You can create your own mind map based on the incoming files of different mind mapping software, and then export the final mind map to any desired format from the list of supported ones.Bubble diagrams with ConceptDraw DIAGRAM
Using ConceptDraw you will be able to create bubble diagrams from the ready ConceptDraw library objects or make your own objects. The created diagram can be saved and edited, objects can be moved and links between them will be automatically repainted after object moving because of using the ConceptDraw connectors.- Entity-Relationship Diagram (ERD) | Quality Mind Maps - samples ...
- Total Quality Management Value | Quality Mind Map | Total Quality ...
- Basic Diagramming | Mathematics | Bar Diagram Math | Example Of ...
- Business Diagram Software | Quality Mind Maps - samples and ...
- Mind Map Exchange | Business Productivity Area | Venn diagrams ...
- Mind Map Exchange | Swot Analysis Examples | Marketing | Mind ...
- Fishbone Problem Solving | Venn Diagram Examples for Problem ...
- Quality Mind Map | Total Quality Management TQM Diagrams | TQM ...
- Software for Creating SWOT Analysis Diagrams | Swot Analysis ...
- Marketing | SWOT Sample in Computers | Mind Maps for Business ...
- Porter's value chain matrix diagram | SWOT Analysis | Mind Maps for ...
- Applications | Education Mind Maps | eLearning for Skype | Mind ...
- Entity-Relationship Diagram (ERD)
- eLearning for Skype | Business Diagram Software | Skype as ...
- Swot Analysis Examples for Mac OSX | Mind Maps for Business ...
- Quality Mind Map | Quality Mind Maps - samples and templates
- Collaboration Area | Word Exchange | SWOT Sample in Computers ...
- Mind Map Organizational Chart
- How to Create a Fishbone (Ishikawa) Diagram Quickly | How to ...
- Constant improvement of key performance indicators | Quality Mind ...
- ERD | Entity Relationship Diagrams, ERD Software for Mac and Win
- Flowchart | Basic Flowchart Symbols and Meaning
- Flowchart | Flowchart Design - Symbols, Shapes, Stencils and Icons
- Flowchart | Flow Chart Symbols
- Electrical | Electrical Drawing - Wiring and Circuits Schematics
- Flowchart | Common Flowchart Symbols