Business Diagram Software


Quality Mind Maps - samples and templates

"Value Stream Map (VSM)
1. A tool used to improve a process by identifying added value and eliminating waste.
2. A process map that follows the value creation process.
A. “strap yourself to the product (or service) and see where you go”
3. A process map with data added.
A. Times: processing, wait, cycle.
B. Quality: number of rejects.
C. Inventory.
D. Resources.
1) Number of people.
2) Space.
3) Distance traveled.
E. Whatever else is useful for analyzing the process." [ocw.mit.edu/ courses/ aeronautics-and-astronautics/ 16-660j-introduction-to-lean-six-sigma-methods-january-iap-2012/ lecture-notes/ MIT16_ 660JIAP12_ 1-6.pdf]
This sample VSM flowchart shows the value stream in a manufacturing, production control and shipping processes.
This value stream mapping diagram example was created using the ConceptDraw PRO diagramming and vector drawing software extended with the Value Stream Mapping solution from the Quality area of ConceptDraw Solution Park.
Value stream mapping

Types of Flowcharts


Quality Improvement

Constant improvement of key performance indicators

 Quality Mind Map
This solution extends ConceptDraw MINDMAP software with Quality Management Mind Maps (Presentations, Meeting Agendas, Problem to be solved).
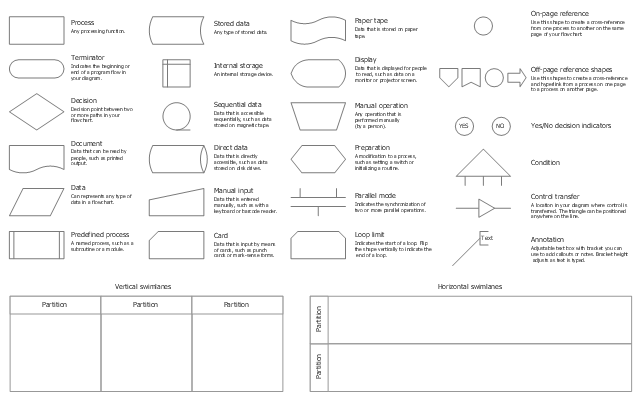
The vector stencils library "Cross-functional flowcharts" contains 31 symbols for creating the deployment flow charts using the ConceptDraw PRO diagramming and vector drawing software.
"A deployment flowchart (sometimes referred to as a "cross functional flowchart") is a business process mapping tool used to articulate the steps and stakeholders of a given process. ...
As deployment flowcharts highlight the relationships between stakeholders in addition to the process flow they are especially useful in highlighting areas of inefficiency, duplication or unnecessary processing. Often utilized within Six sigma activity, completed flowcharts are commonly used to examine the interfaces between “participants” which are typically causes for delays and other associated issues. Deployment flowcharts are useful for determining who within an organization is required to implement a process and are sometimes used as a business planning tool." [Deployment flowchart. Wikipedia]
The example "Design elements - Cross-functional flowcharts" is included in the Cross-Functional Flowcharts solution from the Business Processes area of ConceptDraw Solution Park.
Cross-functional flowchart shapes
- Quality Mind Maps - samples and templates | Business Diagram ...
- Business diagrams & Org Charts with ConceptDraw PRO | Process ...
- Quality Mind Maps - samples and templates | Entity Relationship ...
- Best Program to Make Flow Chart Diagrams | How to Create a Cross ...
- Constant improvement of key performance indicators | Quality Mind ...
- Event-driven Process Chain Diagrams EPC | Fishbone Diagram ...
- Flow Chart Diagram Examples - Conceptdraw.com
- Cross-Functional Flowcharts | TQM Software Build Professional ...
- How to Create a Social Media Flowchart | Social Media Response ...
- Flowchart Software | Types of Flowchart - Overview | Flow Diagram ...
- The Best Choice for Creating Diagram | The Best Mac Software for ...
- Constant improvement of key performance indicators | What is a ...
- ConceptDraw Arrows10 Technology | Flowchart Software | Software ...
- Cross-Functional Flowcharts | Flow Diagram Software | Create Flow ...
- Fishbone Diagram | Types of Flowchart - Overview | Flow Diagram ...
- Business Process Diagram | Business Process Mapping How to ...
- Types of Flowchart - Overview | Fishbone Diagram | Process ...
- SWOT Sample in Computers | Fishbone Diagram | Pyramid Diagram |
- Social Media Response | Business Diagram Software | Cross ...
- Entity-Relationship Diagram (ERD) | Cross Functional Flowchart for ...