 Logistics Flow Charts
Logistics Flow Charts solution extends ConceptDraw DIAGRAM functionality with opportunities of powerful logistics management software. It provides large collection of predesigned vector logistic symbols, pictograms, objects and clipart to help you design with pleasure Logistics flow chart, Logistics process flow diagram, Inventory flow chart, Warehouse flowchart, Warehouse management flow chart, Inventory control flowchart, or any other Logistics diagram. Use this solution for logistics planning, to reflect logistics activities and processes of an enterprise or firm, to depict the company's supply chains, to demonstrate the ways of enhancing the economic stability on the market, to realize logistics reforms and effective products' promotion.
OSHA HAZCOM pictograms

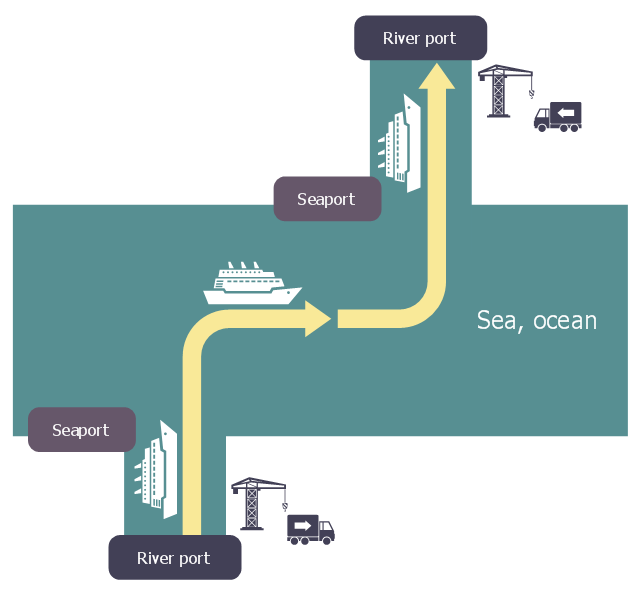
This logistic flow chart sample shows a chain of intermodal transport to link fluvio-maritime.
It was designed on the base of the Wikimedia Commons file: Logistique fluvio-maritime.jpg.
[commons.wikimedia.org/ wiki/ File:Logistique_ fluvio-maritime.jpg]
This file is licensed under the Creative Commons Attribution-Share Alike 3.0 Unported license. [creativecommons.org/ licenses/ by-sa/ 3.0/ deed.en]
"Intermodal freight transport involves the transportation of freight in an intermodal container or vehicle, using multiple modes of transportation (rail, ship, and truck), without any handling of the freight itself when changing modes. The method reduces cargo handling, and so improves security, reduces damage and loss, and allows freight to be transported faster. Reduced costs over road trucking is the key benefit for inter-continental use. This may be offset by reduced timings for road transport over shorter distances." [Intermodal freight transport. Wikipedia]
The logistic flowchart example "Intermodal transport chain" was created using ConceptDraw PRO diagramming and vector drawing software extended with the Logistics Flow Charts solution from the Business Processes area of ConceptDraw Solution Park.
Logistic flowchart
Flow chart ExampleWarehouse Flowchart


IDEF0 Flowchart Symbols

Examples of Flowchart Diagram

 Business Process Mapping
The Business Process Mapping solution has a collection of vector graphic libraries, pre-made templates, and examples of the business process maps. They are useful for many business specialists including economists, politicians, analysts, and other economic experts, officials and state managers for making the unique and professionally looking drawings. Use it to create an effective Business process map, SIPOC diagram, Swim lanes flowchart and clearly define the necessary business processes due to their inputs and outputs.
Database Flowchart Symbols

Cisco People. Cisco icons, shapes, stencils and symbols

 Cross-Functional Flowcharts
The Cross-Functional Flowcharts solution extends ConceptDraw DIAGRAM software with cross functional flowchart examples, samples, and libraries of cross functional flow chart vector design elements and CH-1 symbols for easy drawing professional-looking and illustrative Cross Functional Flowchart, Cross Functional Diagram, CH-1 Diagram, Process Flowchart, Deployment Flowchart, Opportunity Flowchart, Swimlane Process Mapping Diagram, or Visio Cross Functional Flowchart for planning and further analyzing, optimizing and improvement processes. The use of included pre-made cross functional flowchart template, opportunity flowchart template, and swimlane process map template, greatly easier designing your Cross-functional flowcharts.
Flowchart Symbols AccountingActivity-based costing (ABC) flowchart
 flowchart")
Spatial infographics Design Elements: Location Map

Flowchart What is Flowchart

 Social Media Response
The Social Media Response Solution is a combination of innovative tools, ready-made libraries objects, templates, and samples of Interactive Flow Charts of any complexity and the Action Mind Maps, which were developed with a goal to help all people related with a social media to boost their social media success fast and easy. This solution extends ConceptDraw DIAGRAM and ConceptDraw MINDMAP with the ability to draw interactive flow charts with action mind map templates, to help create an effective response to applicable social media mentions.
HR Flowchart Symbols

 Process Flowcharts
This solution extends ConceptDraw DIAGRAM software with templates, samples, and library of vector shapes for drawing the Process Flowcharts.
Sales Process Flowchart Symbols

Geo Map - Europe - Denmark

UML Class Diagram Example for Transport System

- Flowchart Components | Transportation Infographics
- Flowchart Components | Chart Showing Means Of Transport
- Basic Flowchart Symbols and Meaning | Aerospace and Transport
- Drawing Illustration | Flow Chart For Means Of Transport For Kids
- Logistics Flow Charts | Modes Of Transport Chart
- Basic Flowchart Symbols and Meaning | Aerospace and Transport
- Basic Flowchart Symbols and Meaning | Use the Best FlowChart ...
- Aerospace and Transport | Event-driven Process Chain Diagrams
- Road Transport | Basic Flowchart Symbols and Meaning | Watercraft
- UML Class Diagram Example - Apartment Plan | Audit Flowcharts ...