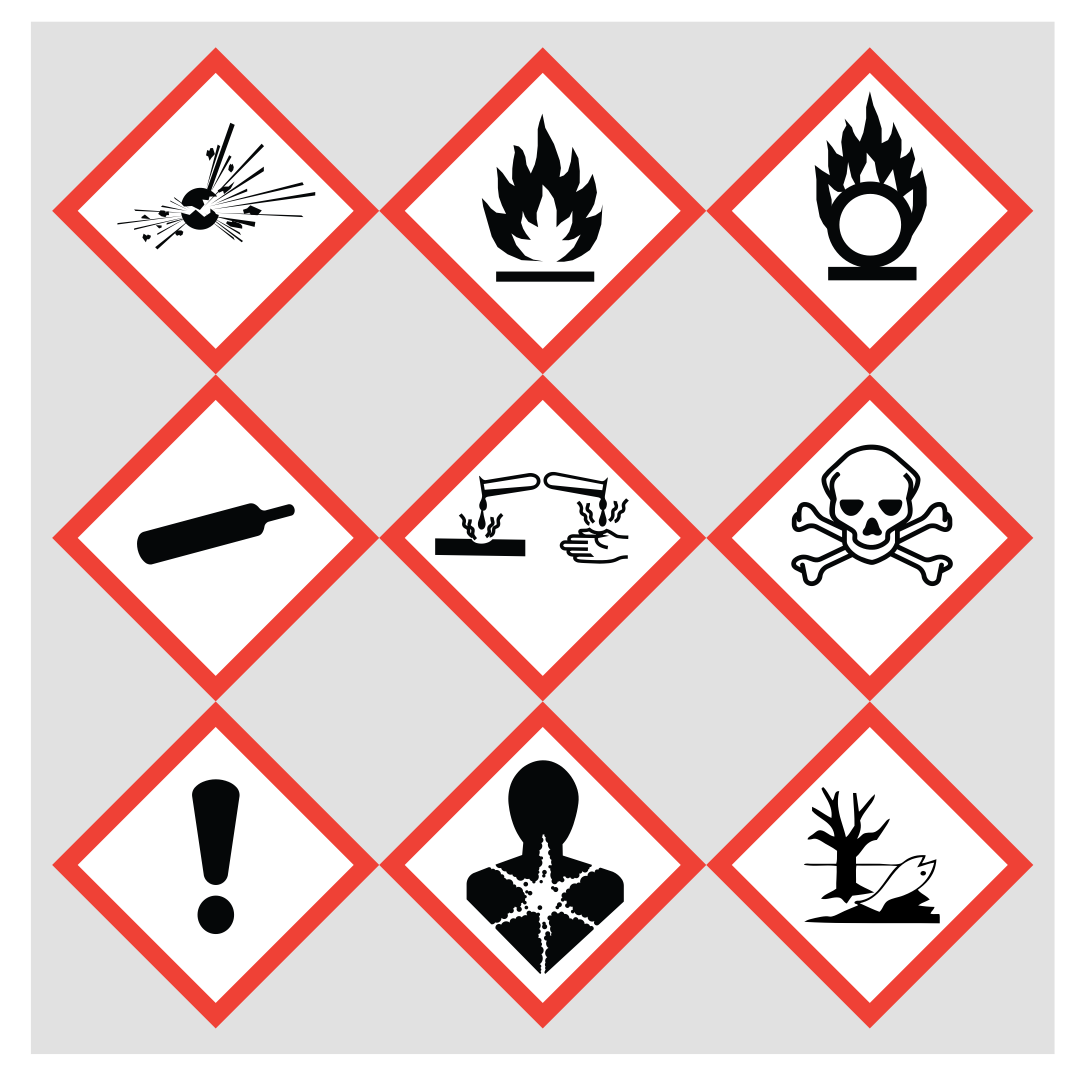
Example 1. OSHA HAZCOM pictograms
All predesigned pictograms offered by GHS Hazard Pictograms library from the GHS Hazard Pictograms Solution are vector, so you have a complete freedom of actions with them. They can be easy placed and aligned according to our needs, as well as resized without any loss of quality.

Example 2. Design Safety Infographic with OSHA HAZCOM pictograms - Acetato di etile
The samples you see on this page were created in ConceptDraw DIAGRAM software using the GHS Hazard Pictograms solution. They represent the list of OSHA HAZCOM pictograms according to the OSHA HAZCOM Standard and their use in Safety infographics. An experienced user spent 5-10 minutes creating these samples.
Use the GHS Hazard Pictograms Solution for ConceptDraw DIAGRAM software to create your own professional looking Chemical safety infographics quick, easy and effective.
All source documents are vector graphic documents. They are available for reviewing, modifying, or converting to a variety of formats (PDF file, MS PowerPoint, MS Visio, and many other graphic formats) from the ConceptDraw STORE. The GHS Hazard Pictograms Solution is available for all ConceptDraw DIAGRAM
NINE RELATED HOW TO's:
ConceptDraw DIAGRAM diagramming and vector drawing software extended with tools of Flowcharts Solution from the Diagrams Area of ConceptDraw Solution Park ideally suits for fast and easy Online Flow Chart designing. We propose to verify this right now.
Picture: Online Flow Chart
Related Solution:
Plumbing systems are very important for any manufacture, and it's a good practice to have a clear scheme of that system. To create one, you should use a piping and instrumentation diagram software with a possibility to save files in vector format, so you can print them without quality loss. ConceptDraw DIAGRAM is a great tool for creating diagrams, and you don't need to be very experienced to use it efficiently.
This example of Piping and Instrumentation Diagram (P&ID) depicts a scheme that illustrates the physical sequence and functional communications of piping, instrumentation and plumbing equipment components of a typical food trailer.
Seeking to avoid health troubles in a mobile food service , the plumbing demands for food trailers must be considered accurately. This P&ID shows all of piping including a basic set of piping system components along with multiple sinks, extra water heaters and other elements to meet health guidelines.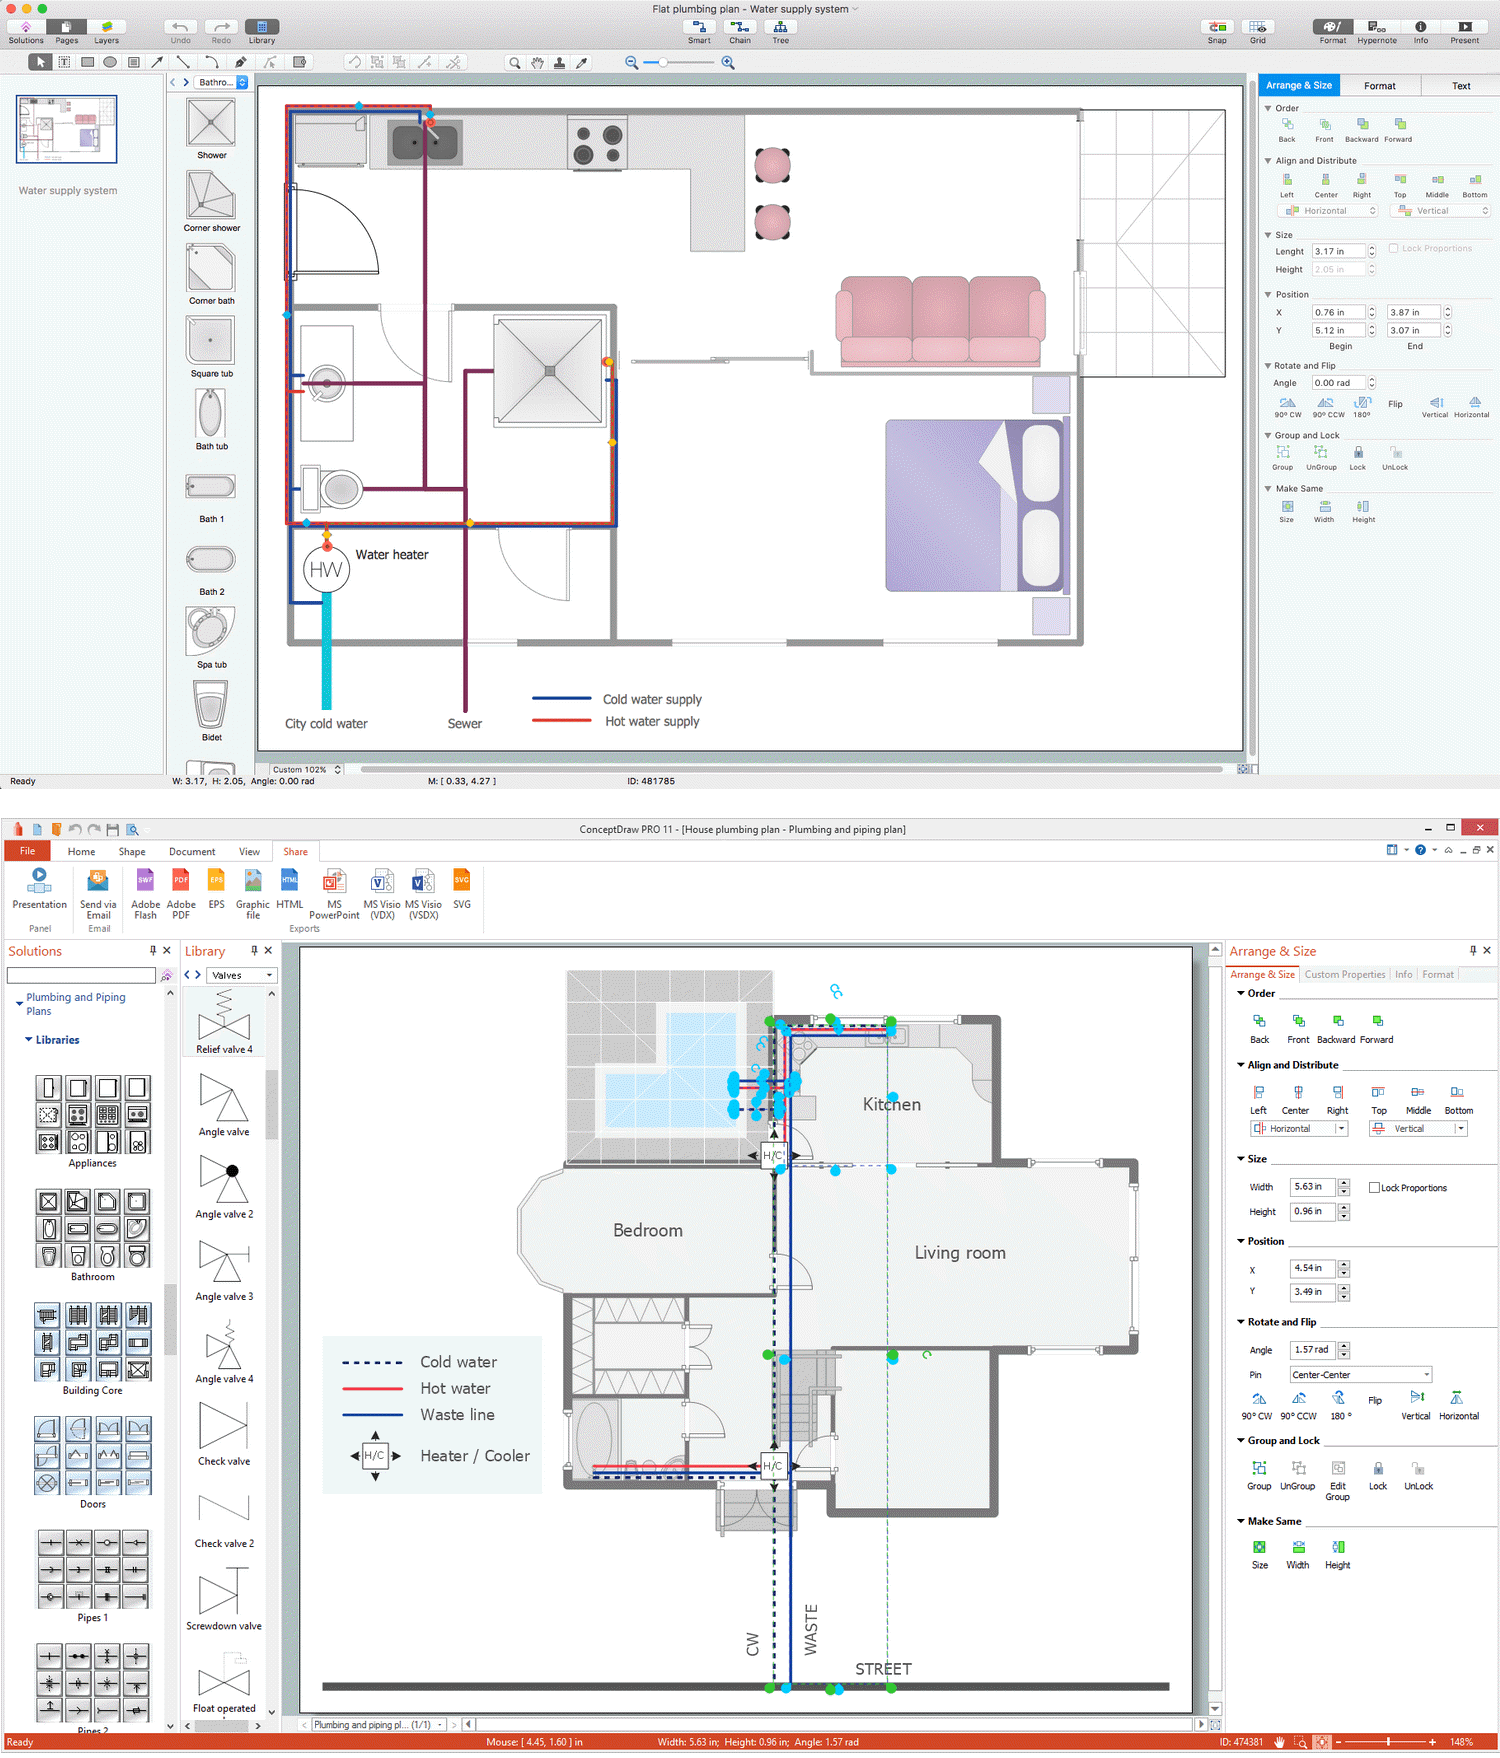
Picture: Piping and Instrumentation Diagram Software
Related Solution:
ConceptDraw DIAGRAM extended with Chemistry solution is effective for drawing various organic chemistry schemes, diagrams, illustrations thanks to the included collection of predesigned organic chemistry symbols
Picture: Organic Chemistry Symbols
Related Solution:
If you need to describe some process, diagramming is a perfect tool for almost any imaginable purpose. The set of the most commonly used flow charts symbols is quite wide and includes symbols for operations, processes, data inputs and outputs. You can see the full list of all the symbols used for flowcharting in Flowcharts solution from Diagrams area in ConceptDraw Solution Park.
A flow chart is often used for visual representation of a sequential process flow. The flowchart approach to any process is to divide it into some sequential actions. What makes a flow chart so popular and clear to make out is the set of standard flowchart symbols that has the same reading independently from processes described with their applying. The current drawing represents the vector library containing the pack of standard flowchart symbols. This library is supplied with ConceptDraw Flowcharts solution.
Picture: Flow Chart Symbols
Related Solution:
Compare flowchart software by type, features, and workflow fit. Learn the difference between desktop and online tools and choose the right solution for documentation or collaboration.
Picture: Flowchart Software: Tools for Process and Workflow Diagramming
Related Solution:
Mongolia is a landlocked country in Central Asia.
The vector stencils library Mongolia contains contours for ConceptDraw DIAGRAM diagramming and vector drawing software. This library is contained in the Continent Maps solution from Maps area of ConceptDraw Solution Park.
Picture: Geo Map - Asia - Mongolia
Related Solution:
A lot of business process techniques are able to be applied in regular life. Although this tool is considered to be used for business purposes, you can make a SWOT template for yourself. In fact, any obstacle might become a subject for SWOT analysis.
ConceptDraw solution for SWOT analysis solution provides a power visual maintenance of a SWOT analysis. It is a procedure of strategic planning made to discover the Strengths, Weaknesses, Opportunities, and Threats business meet. This mind map template for ConceptDraw MINDMAP isually maintains investigation of good and bad factors. For example, factors that provides an advantage over others are strength; factors that brings a disadvantage are factors of weakness. After the analysis is finished, transfer your data to create a SWOT matrix in ConceptDraw DIAGRAM.
Picture: SWOT Template
ConceptDraw DIAGRAM is a powerful tool that helps you create a Cross Functional Flow Chart quickly and easily. Fine-tuning the objects in ConceptDraw DIAGRAM allows you to create a really professional finished article. ConceptDraw Arrows10 Technology gives drawing connectors a smart behavior that provides quick and precise placement, allows for easy changes and automatic rearrangement.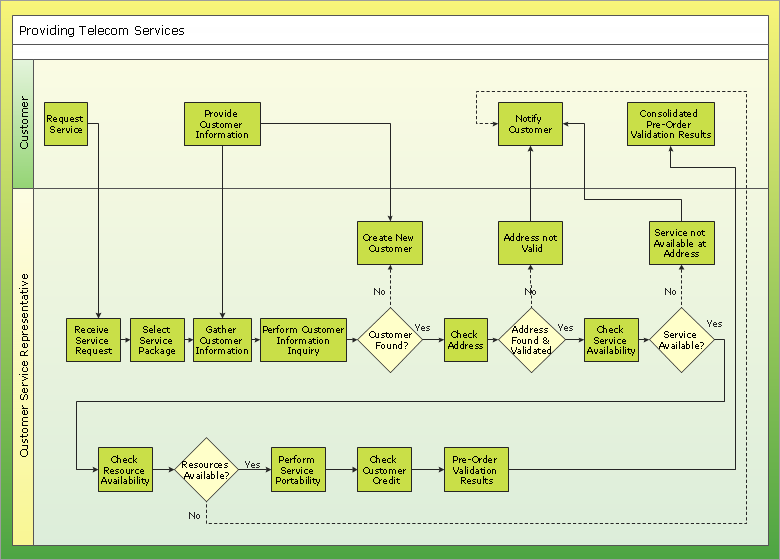
Picture: Double-headed Cross Functional Flowchart
Related Solution:
A process flow chart is a sequence diagram on events, actions, tasks and decisions that are visualized in a form of inputs and outputs. Such flow chart involves a defined number of standard symbols and notation keys used to help one understand and pass the information.
Process flow charts have become a day-to-day tool for chemical engineers, technologists and production engineers as well as software developers. However, their use has recently increased in other areas such as business, manufacturing and, especially a service sector.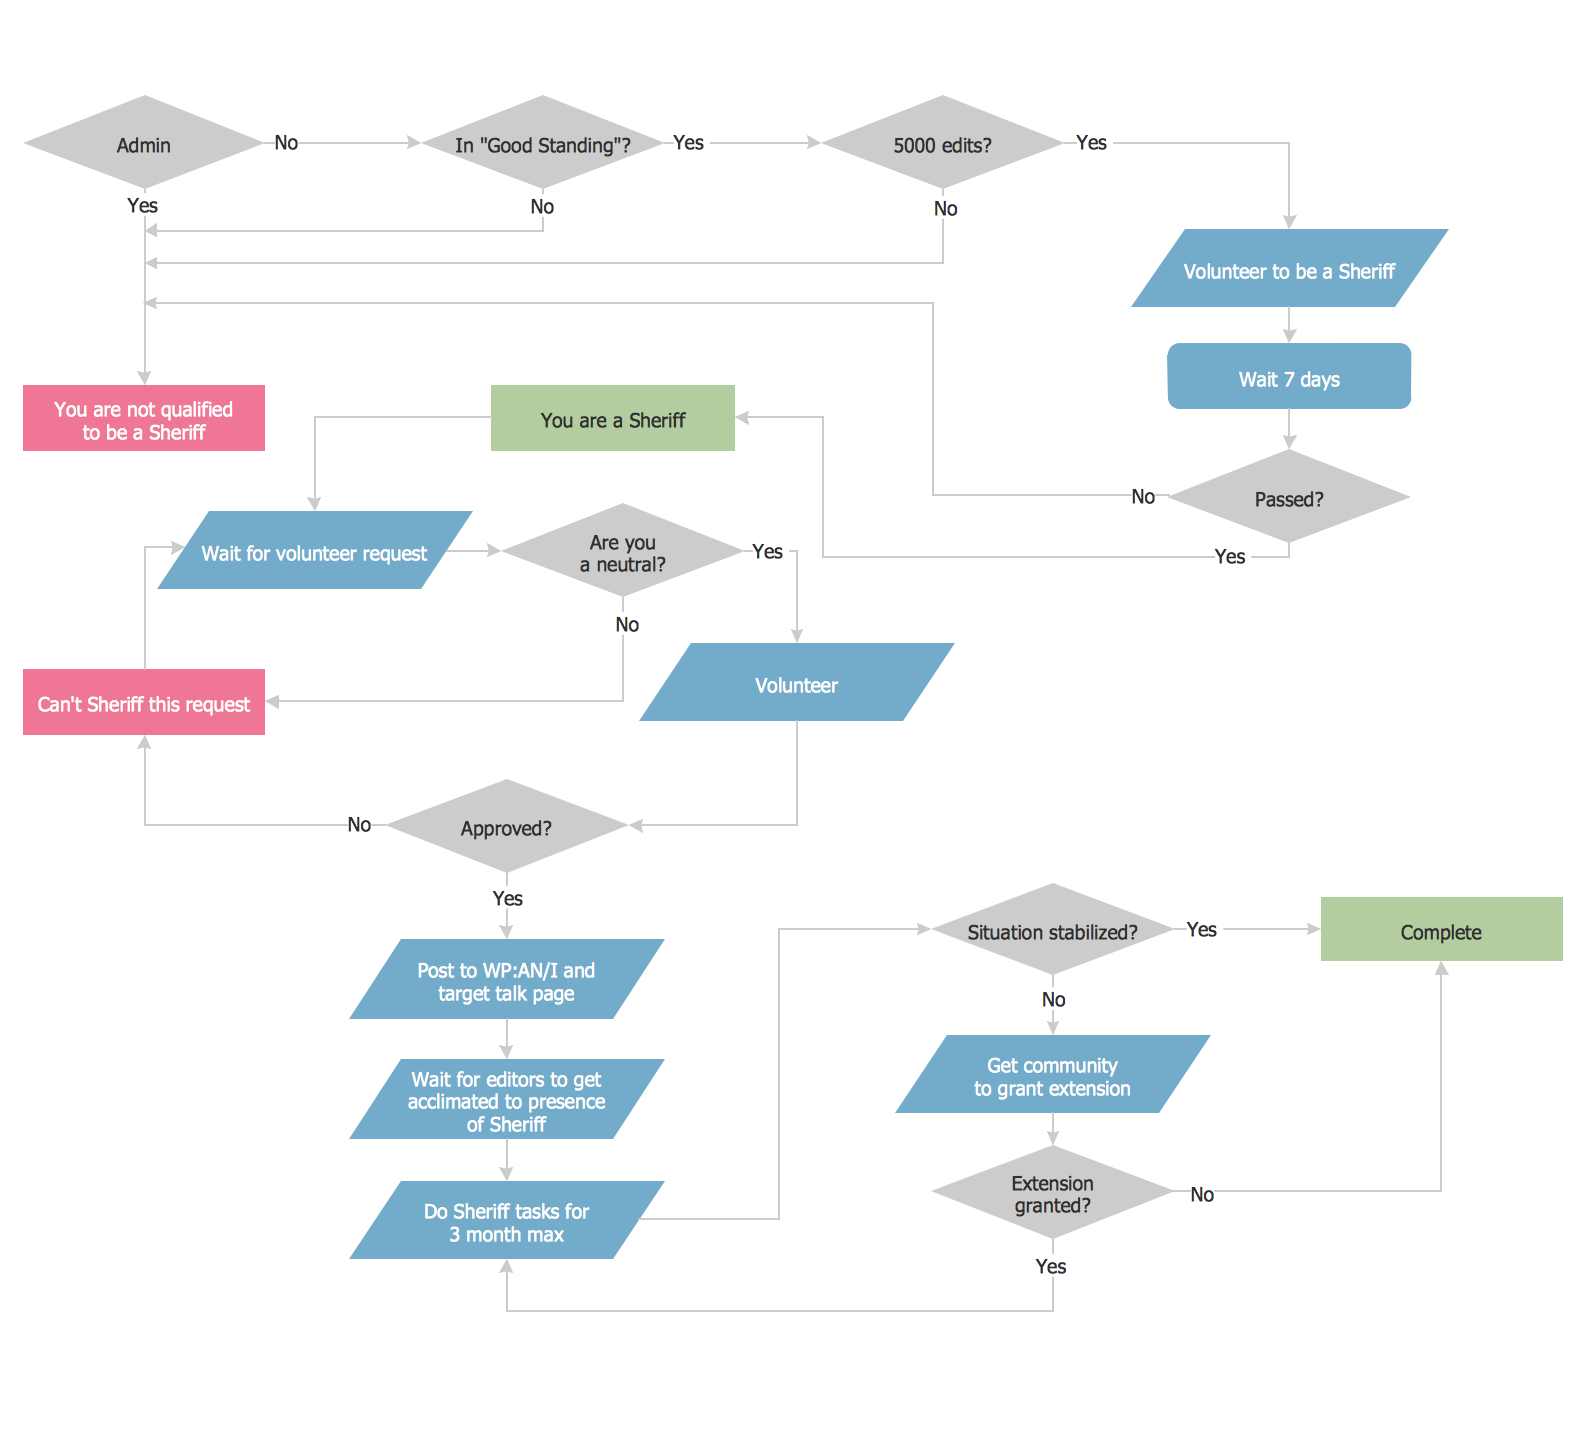
Picture: Example Process Flow Chart
Related Solution:
