Line Graph

Line Chart Examples

 Line Graphs
How to draw a Line Graph with ease? The Line Graphs solution extends the capabilities of ConceptDraw PRO v10 with professionally designed templates, samples, and a library of vector stencils for drawing perfect Line Graphs.
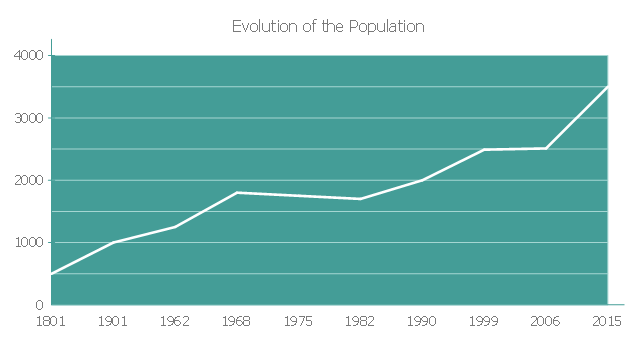
This line chart example showing evolution of the population from 1801 till nowadays was redesigned from the Wikimedia Commons file:
Evolution de la population vertoise 1801 maintenant.JPG
[commons.wikimedia.org/ wiki/ File:Evolution_ de_ la_ population_ vertoise_ 1801_ maintenant.JPG].
"Evolution is the change in the inherited characteristics of biological populations over successive generations. Evolutionary processes give rise to diversity at every level of biological organisation, including species, individual organisms and molecules such as DNA and proteins.
All life on Earth is descended from a last universal ancestor that lived approximately 3.8 billion years ago. Repeated speciation and the divergence of life can be inferred from shared sets of biochemical and morphological traits, or by shared DNA sequences. These homologous traits and sequences are more similar among species that share a more recent common ancestor, and can be used to reconstruct evolutionary histories, using both existing species and the fossil record. Existing patterns of biodiversity have been shaped both by speciation and by extinction." [Evolution. Wikipedia]
The line graph example "Evolution of the population" was created using the ConceptDraw PRO diagramming and vector drawing software extended with the Line Graphs solution from the Graphs and Charts area of ConceptDraw Solution Park.
Line chart
Basic Diagramming


What Is a Line Chart

Chart Examples

Pictures of Graphs

Picture Graph

 Picture Graphs
Typically, a Picture Graph has very broad usage. They many times used successfully in marketing, management, and manufacturing. The Picture Graphs Solution extends the capabilities of ConceptDraw PRO v10 with templates, samples, and a library of professionally developed vector stencils for designing Picture Graphs.
 Area Charts
Area Charts are used to display the cumulative totals over time using numbers or percentages; or to show trends over time among related attributes. The Area Chart is effective when comparing two or more quantities. Each series of data is typically represented with a different color, the use of color transparency in an object’s transparency shows overlapped areas and smaller areas hidden behind larger areas.
 USA Maps
Use the USA Maps solution to create a map of USA, a US interstate map, printable US maps, US maps with cities and US maps with capitals. Create a complete USA states map.
- Line Graph Of Population
- Line Chart Template for Word | How to Draw a Line Chart Quickly ...
- Basic Diagramming | Population Growth Line Graph
- Basic Diagramming | Line Chart Examples | Chart Examples | Us ...
- Line Chart Examples | Line Graphs | Line Graph | Us Population ...
- Line chart - Evolution of the population | Line Chart Examples | Chart ...
- Basic Diagramming | Line Graphs | Sales Growth. Bar Graphs ...
- Area Charts | San Francisco County Population Line Graph
- Line Chart Examples | Chart Examples | Picture Graphs | Examples ...
- Line Chart Example Of Population Growth
- Line chart - Evolution of the population | Line Chart Examples ...
- Line Chart Examples | Chart Examples | Picture graph - Population ...
- Bar Graph Of Population Growth Rate
- Population growth by continent, 2010 - 2013 - Picture graph ...
- Line Chart Examples | Basic Diagramming | Area Charts | Sample ...
- Bar Graph Template Population Increase
- Picture Graphs | Area Charts | Geo Map - Asia | Population Growth ...
- Line Chart Examples | San Francisco CA population growth ...
- Population growth by continent, 2010 - 2013 - Picture graph | Geo ...
- Basic Diagramming | Picture Graphs | Population Growth Bar Chart